

Amerikanska
Pope Leo XIV to undergo lung surgery this week
Pope Leo XIV said he would undergo surgery after doctors found a "localized nodule" in his lung.
(Image credit: Gregorio Borgia)
Hurricane Simon nears Mexico with 155 mph winds and flooding fears
The eye of Hurricane Simon was just off the Pacific coast of Mexico early Sunday and was expected to move inland later in the day as an extremely powerful storm.
(Image credit: Fernando Llano)
Justice Department investigates TV networks, citing possible anti-trust violations
The move escalates Trump's fight with the press amid court battle over barring CNN, Politico and MS NOW from the White House.
(Image credit: Alex Brandon)
Don't be scared: Being afraid is outright fun, and maybe useful
Listeners of NPR's Weekend Edition Sunday may already know that host Ayesha Rascoe loves horror. But why do scream queens (and kings) like her like what's frightening? The answer may surprise you.
(Image credit: Ryan Benk)
A heroic, 7-day bike ride made this teen a global star. Where is she now?
Her epic ride — carrying her injured dad on her $20 hot pink bicycle — made headlines. Promises were made — financial help, training for a cycling career, even a movie deal. Were any of them kept?
(Image credit: Deepak Paswan)
Sweating the details: Sauna's potential health benefits draw scientists' interest
A group of international researchers is pushing to rigorously study the potential health benefits of sauna and other heat therapies. They hope to bring scientific legitimacy to the age-old practices.
(Image credit: Siv Dolmen for NPR)
In one of the country's most competitive districts, a Democrat tries to keep her seat
In a highly competitive Washington congressional race, the incumbent Democrat has angered part of her party base and the Trump-backed Republican challenger faces backlash against the party in power.
(Image credit: Anna Moneymaker)
Reshaped civil rights mission at Justice Department transforms its work, workforce
Harmeet Dhillon has pushed out hundreds of longtime attorneys, replaced many with inexperienced ideological allies, and used the division's enforcement powers to pursue the president's agenda.
(Image credit: Al Drago)
It's taking longer to find a new job after losing one
People who lose their jobs in this economy are taking longer to find new work. Nearly four in ten people exhaust their unemployment benefits before they land a new job.
(Image credit: Joe Raedle)
Attack on Riyadh airport killed 12 people and wounded over 300 more, Saudi authorities say
Saudi authorities say the latest attack on the international airport in the capital, Riyadh, has killed 12 people and injured over 300. Their statement says the dead on Saturday included four Saudi citizens as well as two Bangladeshi nationals, a Palestinian, a U.S. citizen, an Egyptian, a Jordanian, a Syrian and a Sudanese. It said some of those injured were in critical condition. The attack — the latest of several in the past week on King Khalid International Airport — is expected to increase Saudi pressure on allies including the United States to provide military support for the kingdom.
(Image credit: AP)
Christa Pike discharged from the hospital and back in prison
Pike's attorneys say she is grateful for the care of first responders and her medical team.
(Image credit: Tennessee Department of Correction)
Bayeux Tapestry's London tour spurs enthusiasts to Battle of Hastings reenactment
A reenactment of the Battle of Hastings, which took place almost a millennium ago, is drawing crowds of enthusiasts in the UK.
Trump weighs joining the fight against Houthis after Riyadh airport attack
The surge in attacks, including against other Saudi airports, military facilities and oil infrastructure, has come in the week since a Saudi-led coalition launched a major military offensive against the Houthis.
(Image credit: UGC via AP)
Under Autumn’s Spell (October 2026 Wallpapers Edition)
Misty mornings, leaves shining in bright red, yellow, and orange hues, and spooky creatures making an appearance — October has a very special charm. So, how about some new desktop wallpapers to celebrate October’s beauty, and the upcoming Halloween season, of course? Well, we’ve got you covered.
Just like it has been a monthly tradition here at Smashing Magazine for more than 15 years already, the wallpapers in this post were created by artists and designers from across the globe. All of them come in a variety of screen resolutions and can be downloaded for free. A huge thank-you to everyone who shared their designs with us — you are truly smashing!
Now, before you pick your favorite for the month, did you know that you can also get featured in one of our upcoming wallpapers posts? We are always looking for creative talent, so please don’t hesitate to join in. We’d love to see what you come up with!
- You can click on every image to see a larger preview.
- We respect and carefully consider the ideas and motivation behind each and every artist’s work. This is why we give all artists the full freedom to explore their creativity and express emotions and experience through their works. This is also why the themes of the wallpapers weren’t anyhow influenced by us but rather designed from scratch by the artists themselves.
“From candlelit streets in Europe to vibrant festivals across the Americas, Halloween has become a global celebration that unites people of all ages. It is a magical night where children step into the shoes of their favorite heroes for candy-filled adventures, while adults rediscover the pure, playful excitement of childhood. Across cultures and continents, glowing pumpkins and festive costumes light up the autumn dark, bringing neighbors together, sparking laughter, and proving that joy knows no age limit.” — Designed by PopArt Studio from Novi Sad, Serbia.

- preview
- with calendar: 320x480, 640x480, 800x480, 800x600, 1024x768, 1024x1024, 1152x864, 1280x720, 1280x800, 1280x960, 1280x1024, 1400x1050, 1440x900, 1600x1200, 1680x1050, 1680x1200, 1920x1080, 1920x1200, 1920x1440, 2560x1440
- without calendar: 320x480, 640x480, 800x480, 800x600, 1024x768, 1024x1024, 1152x864, 1280x720, 1280x800, 1280x960, 1280x1024, 1400x1050, 1440x900, 1600x1200, 1680x1050, 1680x1200, 1920x1080, 1920x1200, 1920x1440, 2560x1440

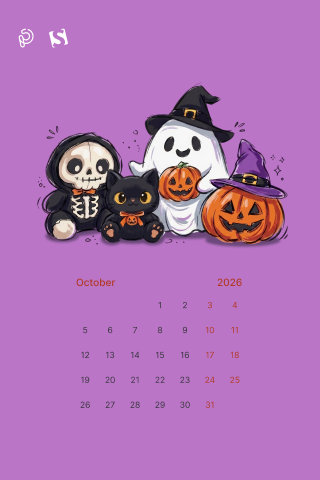







































Designed by Ricardo Gimenes from Spain.

- preview
- with calendar: 640x480, 800x480, 800x600, 1024x768, 1024x1024, 1152x864, 1280x720, 1280x960, 1280x1024, 1366x768, 1400x1050, 1440x900, 1600x1200, 1680x1050, 1680x1200, 1920x1080, 1920x1200, 1920x1440, 2560x1440, 3840x2160
- without calendar: 640x480, 800x480, 800x600, 1024x768, 1024x1024, 1152x864, 1280x720, 1280x960, 1280x1024, 1366x768, 1400x1050, 1440x900, 1600x1200, 1680x1050, 1680x1200, 1920x1080, 1920x1200, 1920x1440, 2560x1440, 3840x2160

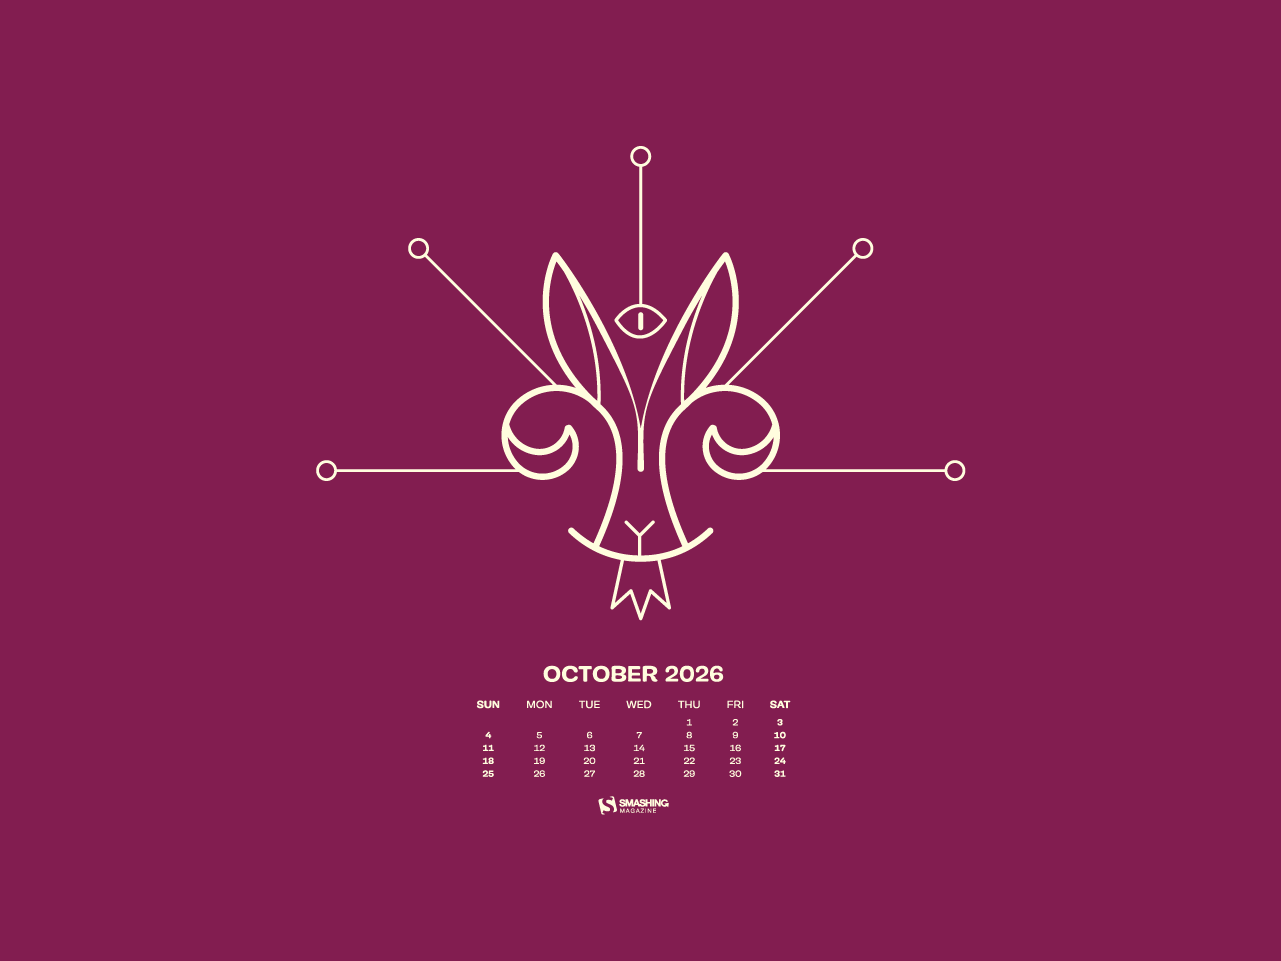
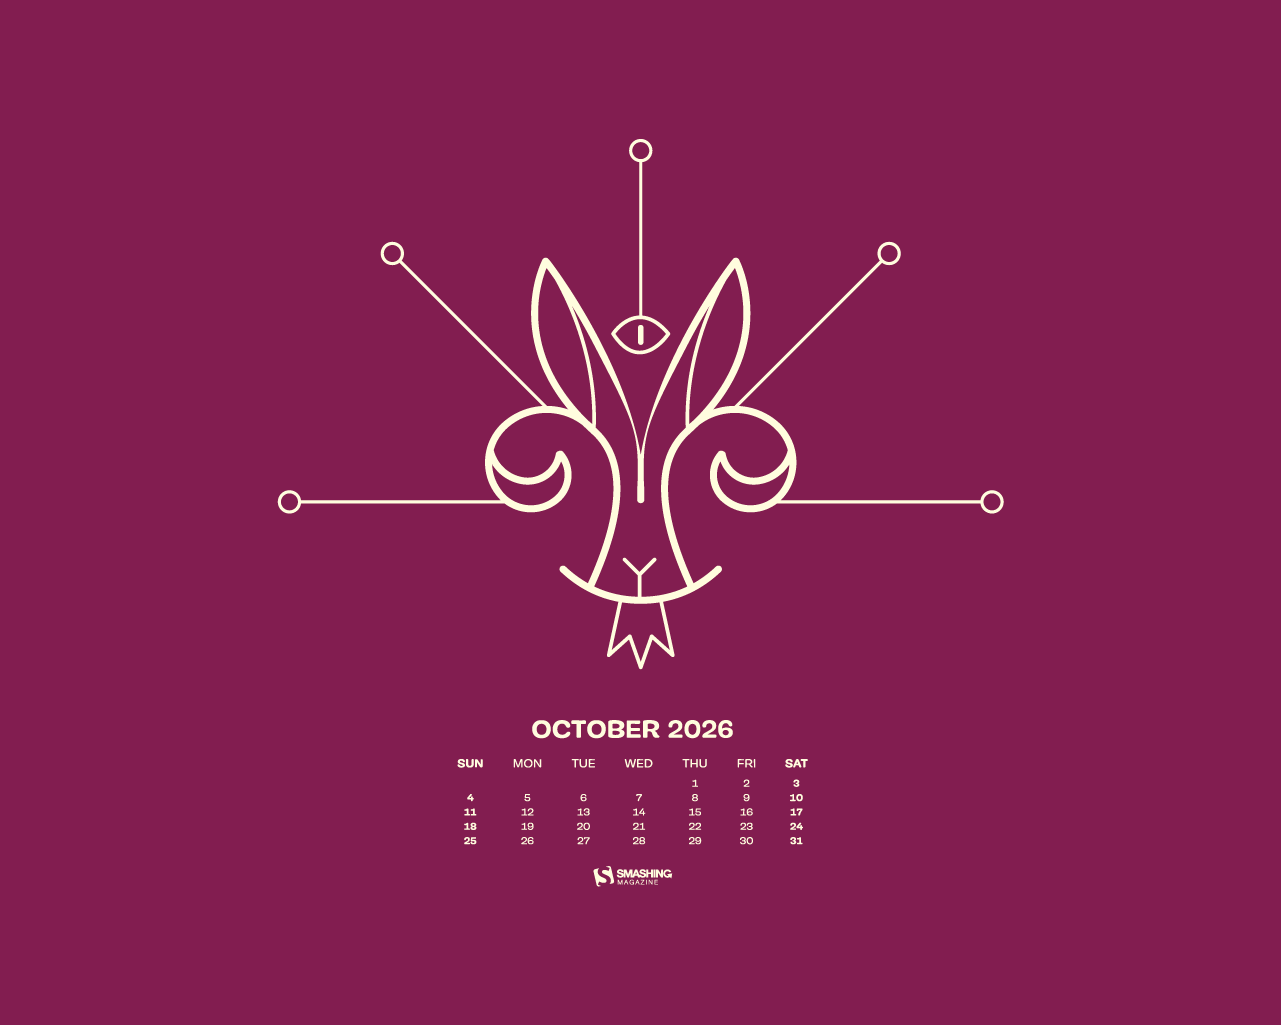
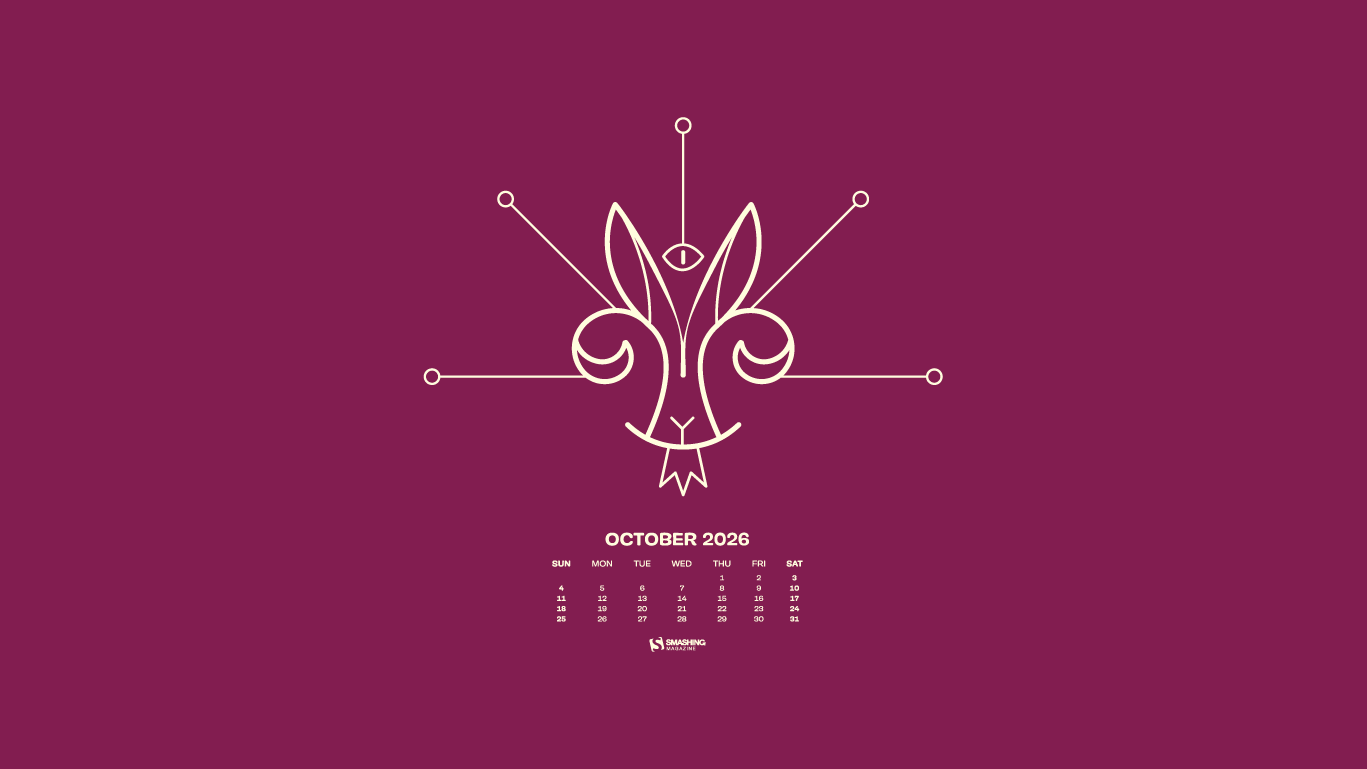
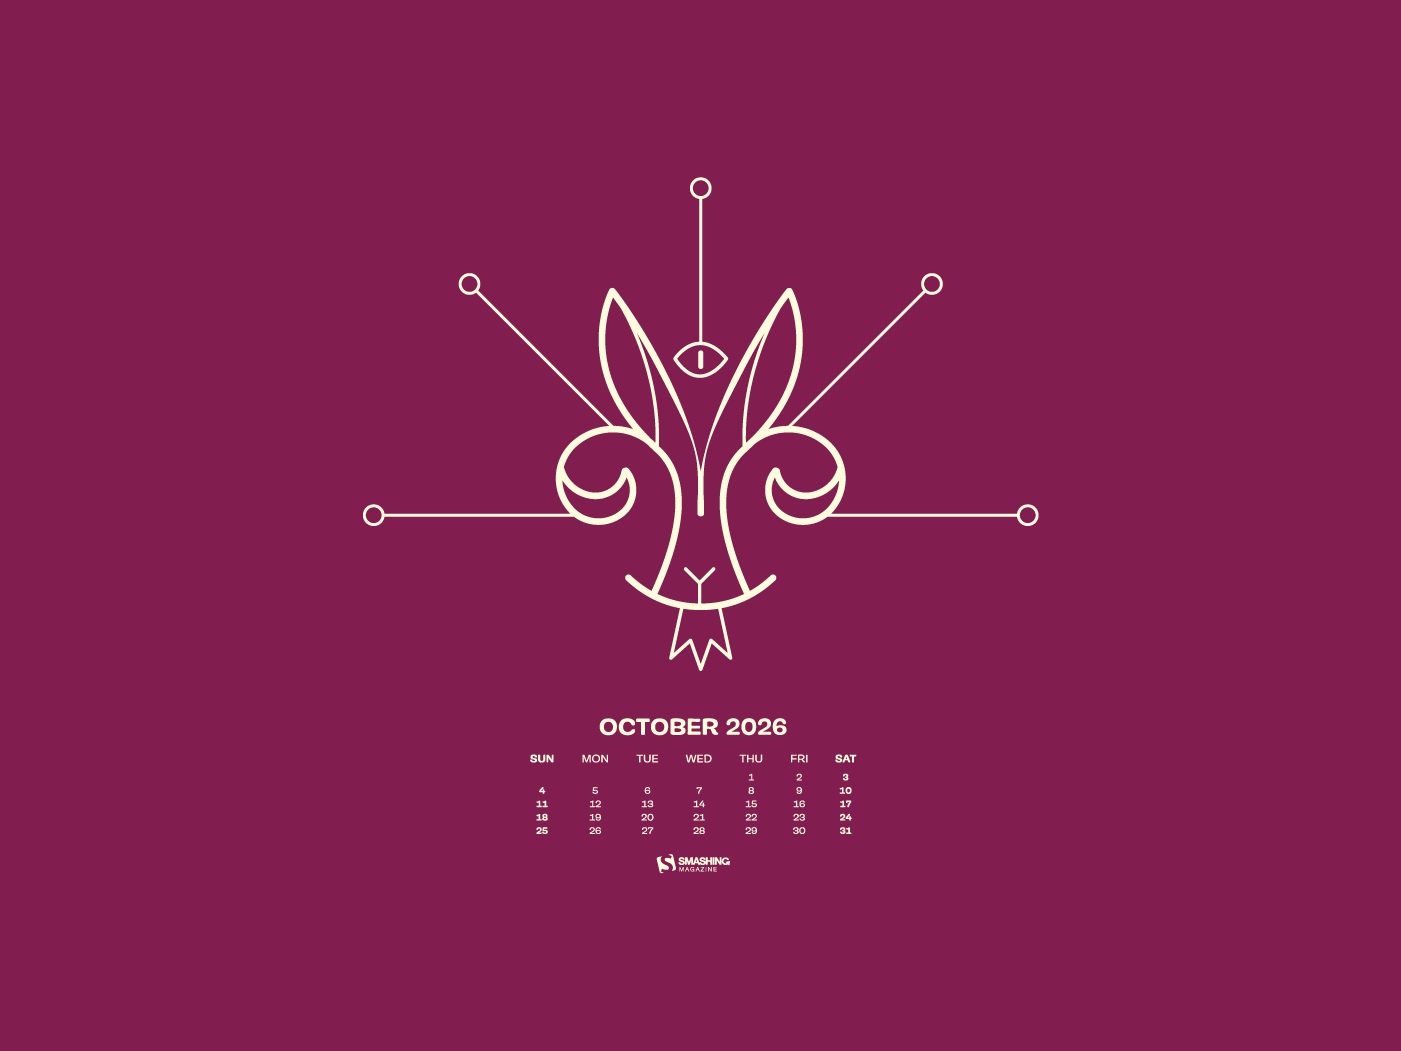

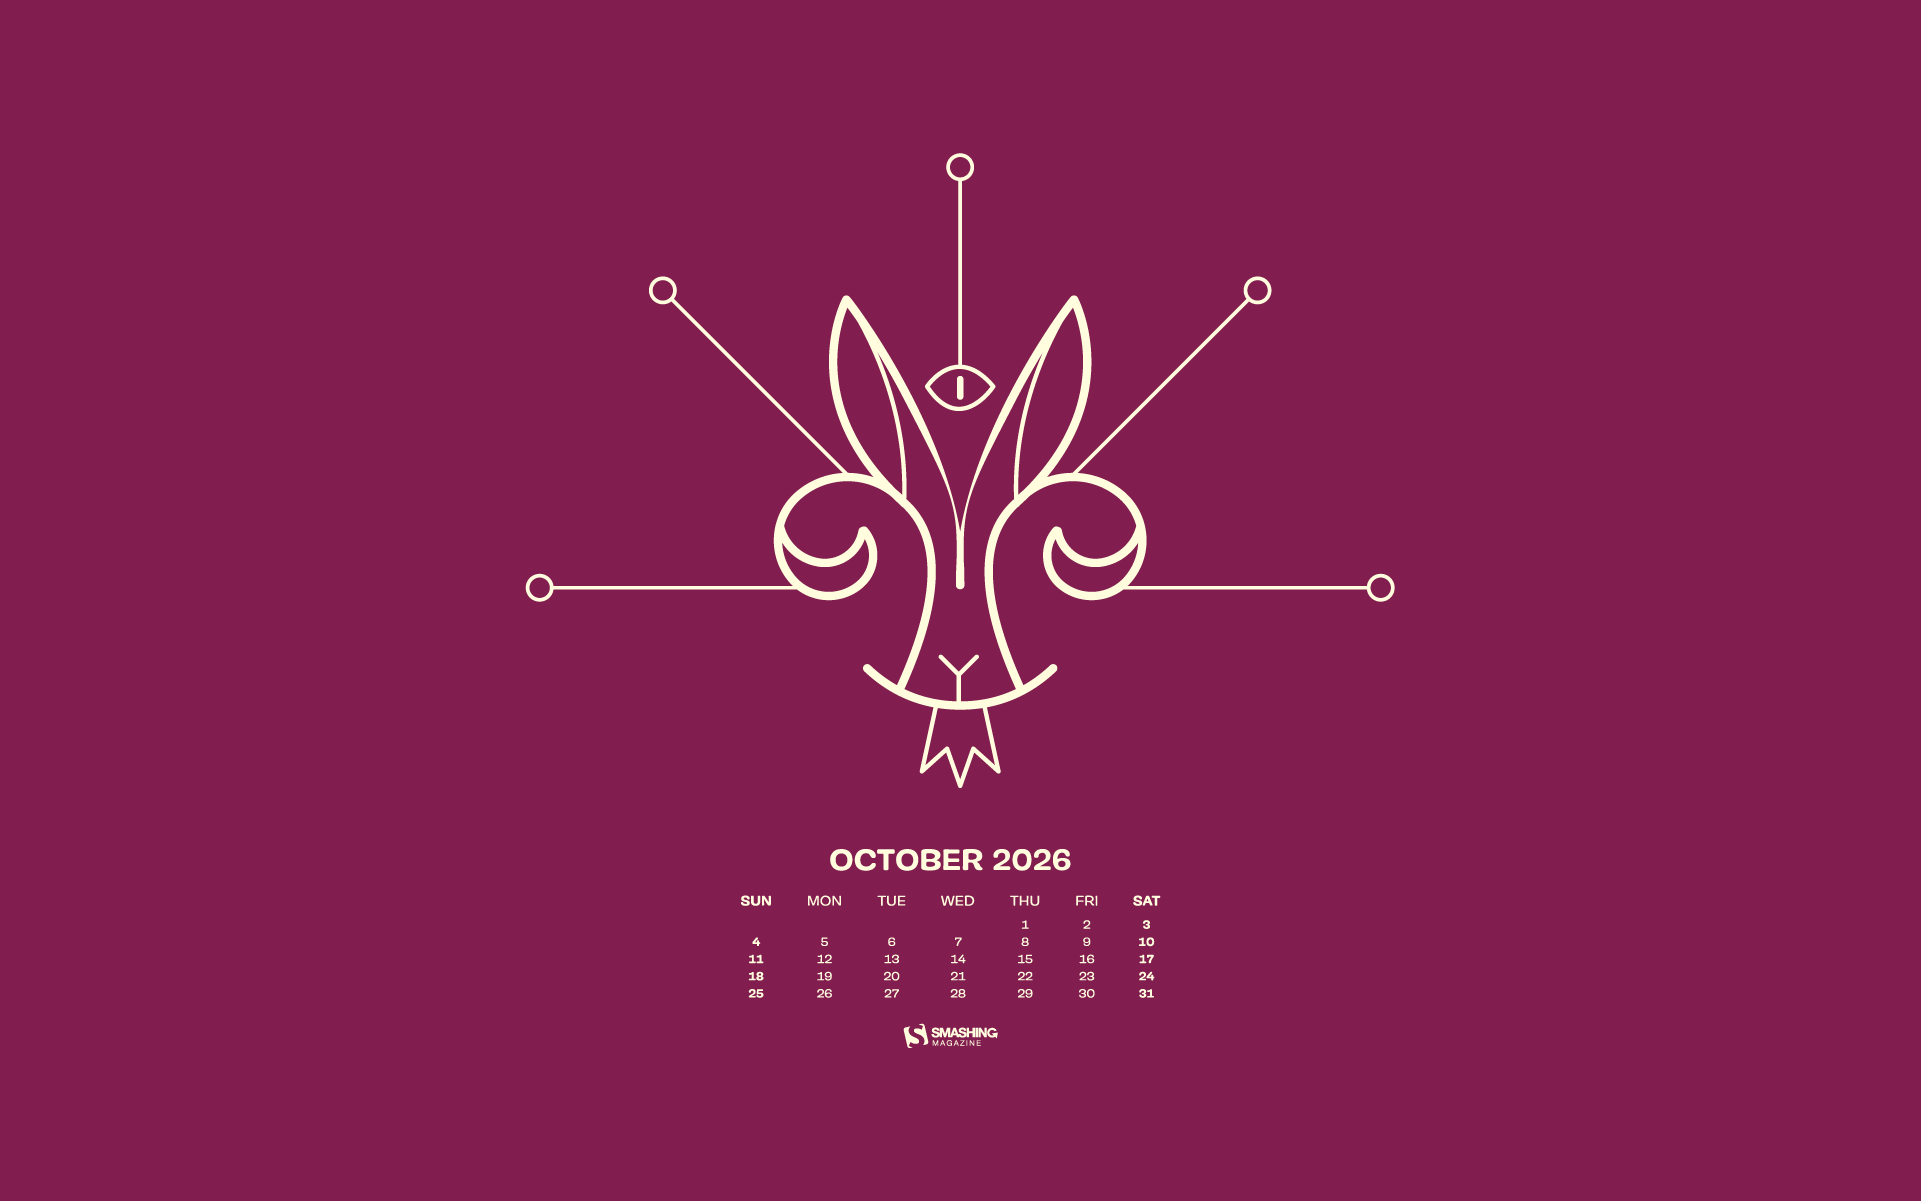




















Designed by Ricardo Gimenes from Spain.
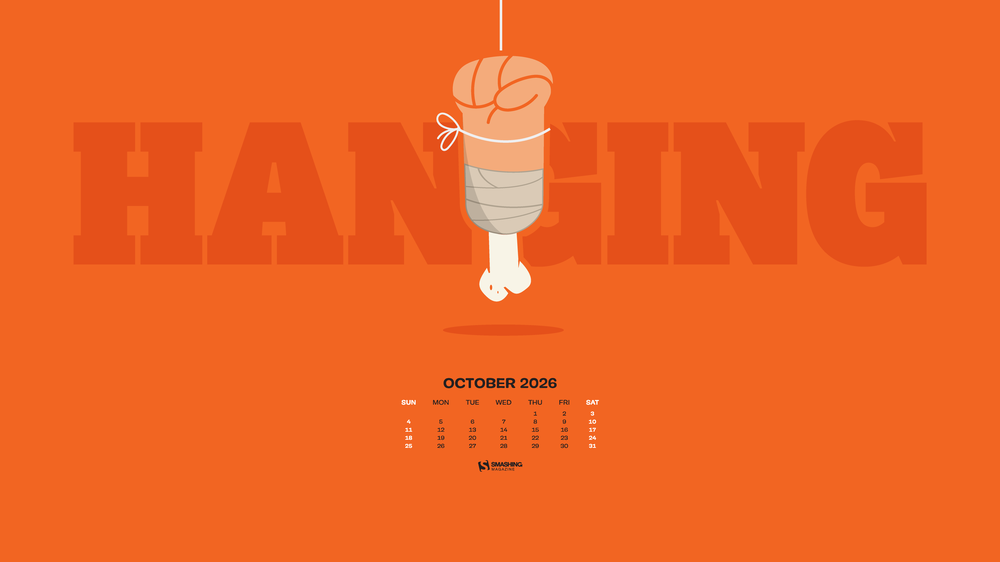
- preview
- with calendar: 640x480, 800x480, 800x600, 1024x768, 1024x1024, 1152x864, 1280x720, 1280x800, 1280x960, 1280x1024, 1366x768, 1400x1050, 1440x900, 1600x1200, 1680x1050, 1680x1200, 1920x1080, 1920x1200, 1920x1440, 2560x1440, 3840x2160
- without calendar: 640x480, 800x480, 800x600, 1024x768, 1024x1024, 1152x864, 1280x720, 1280x800, 1280x960, 1280x1024, 1366x768, 1400x1050, 1440x900, 1600x1200, 1680x1050, 1680x1200, 1920x1080, 1920x1200, 1920x1440, 2560x1440, 3840x2160
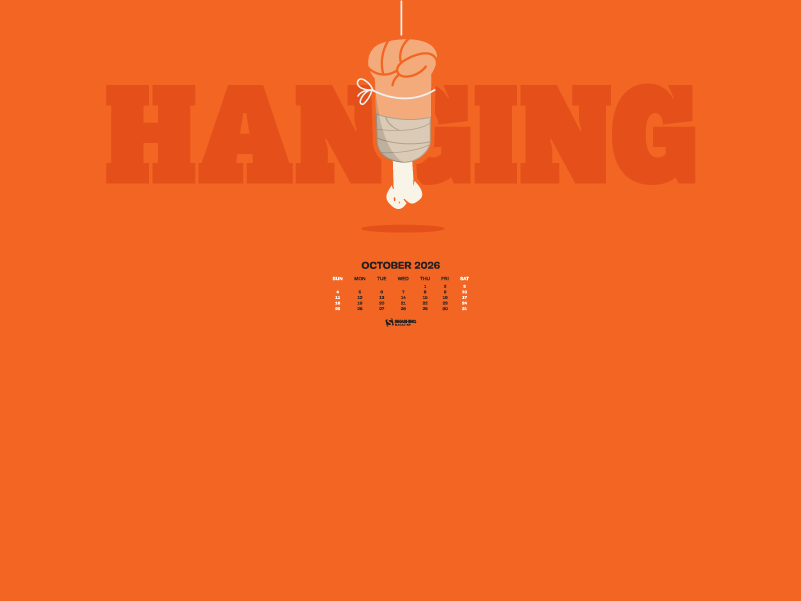
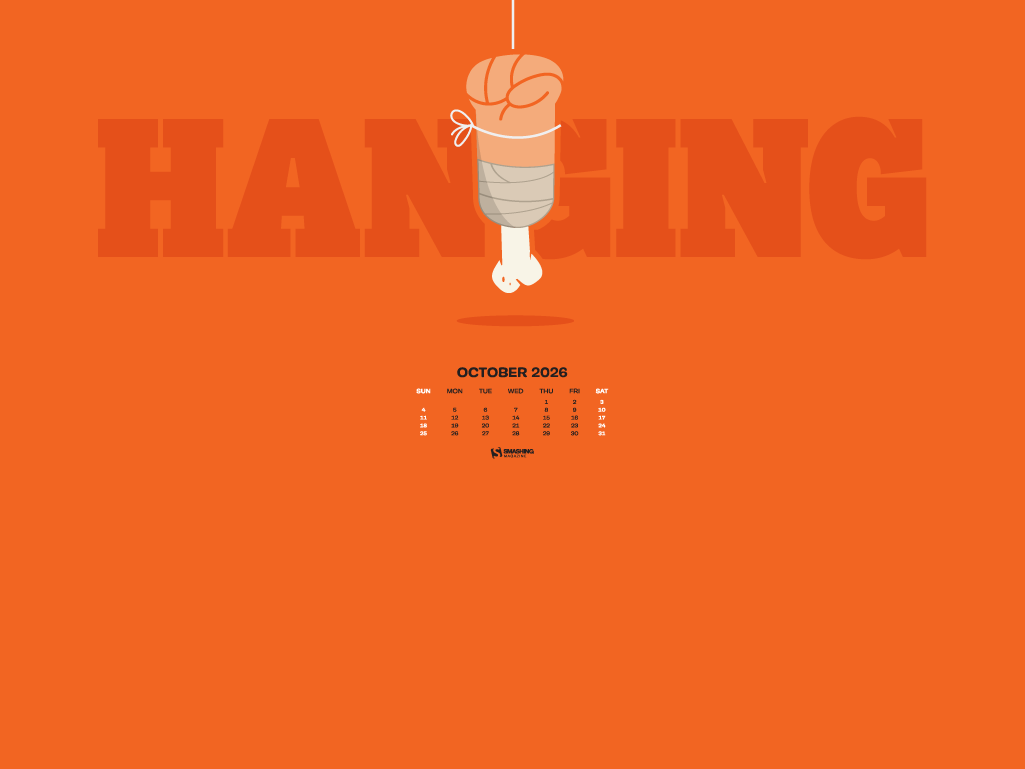
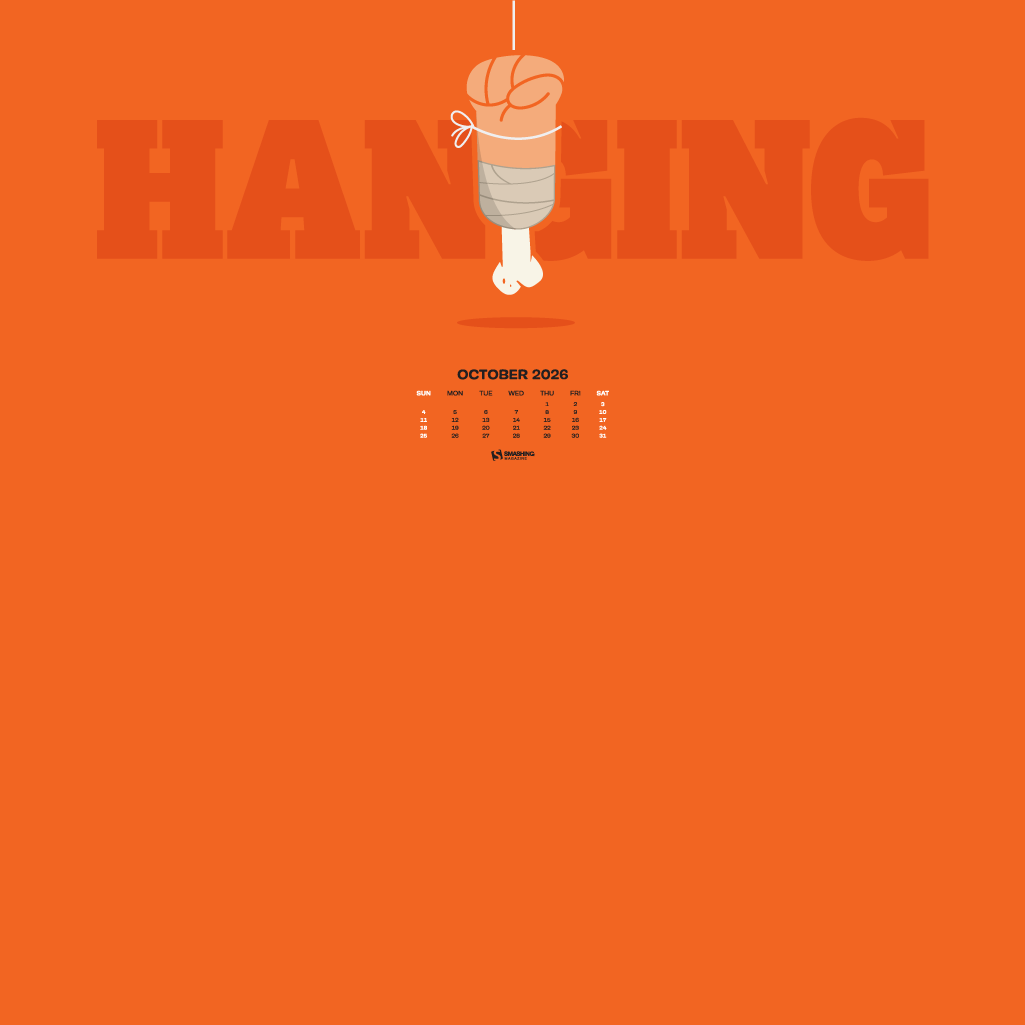
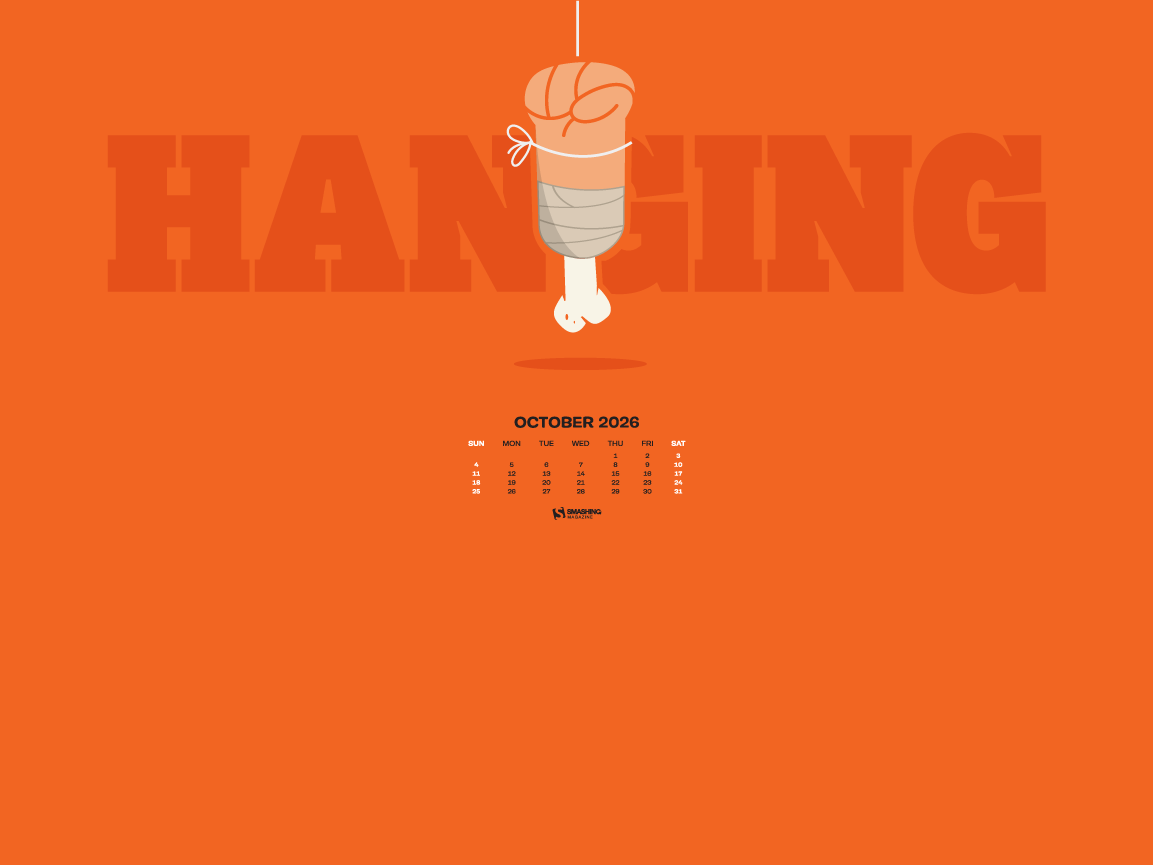
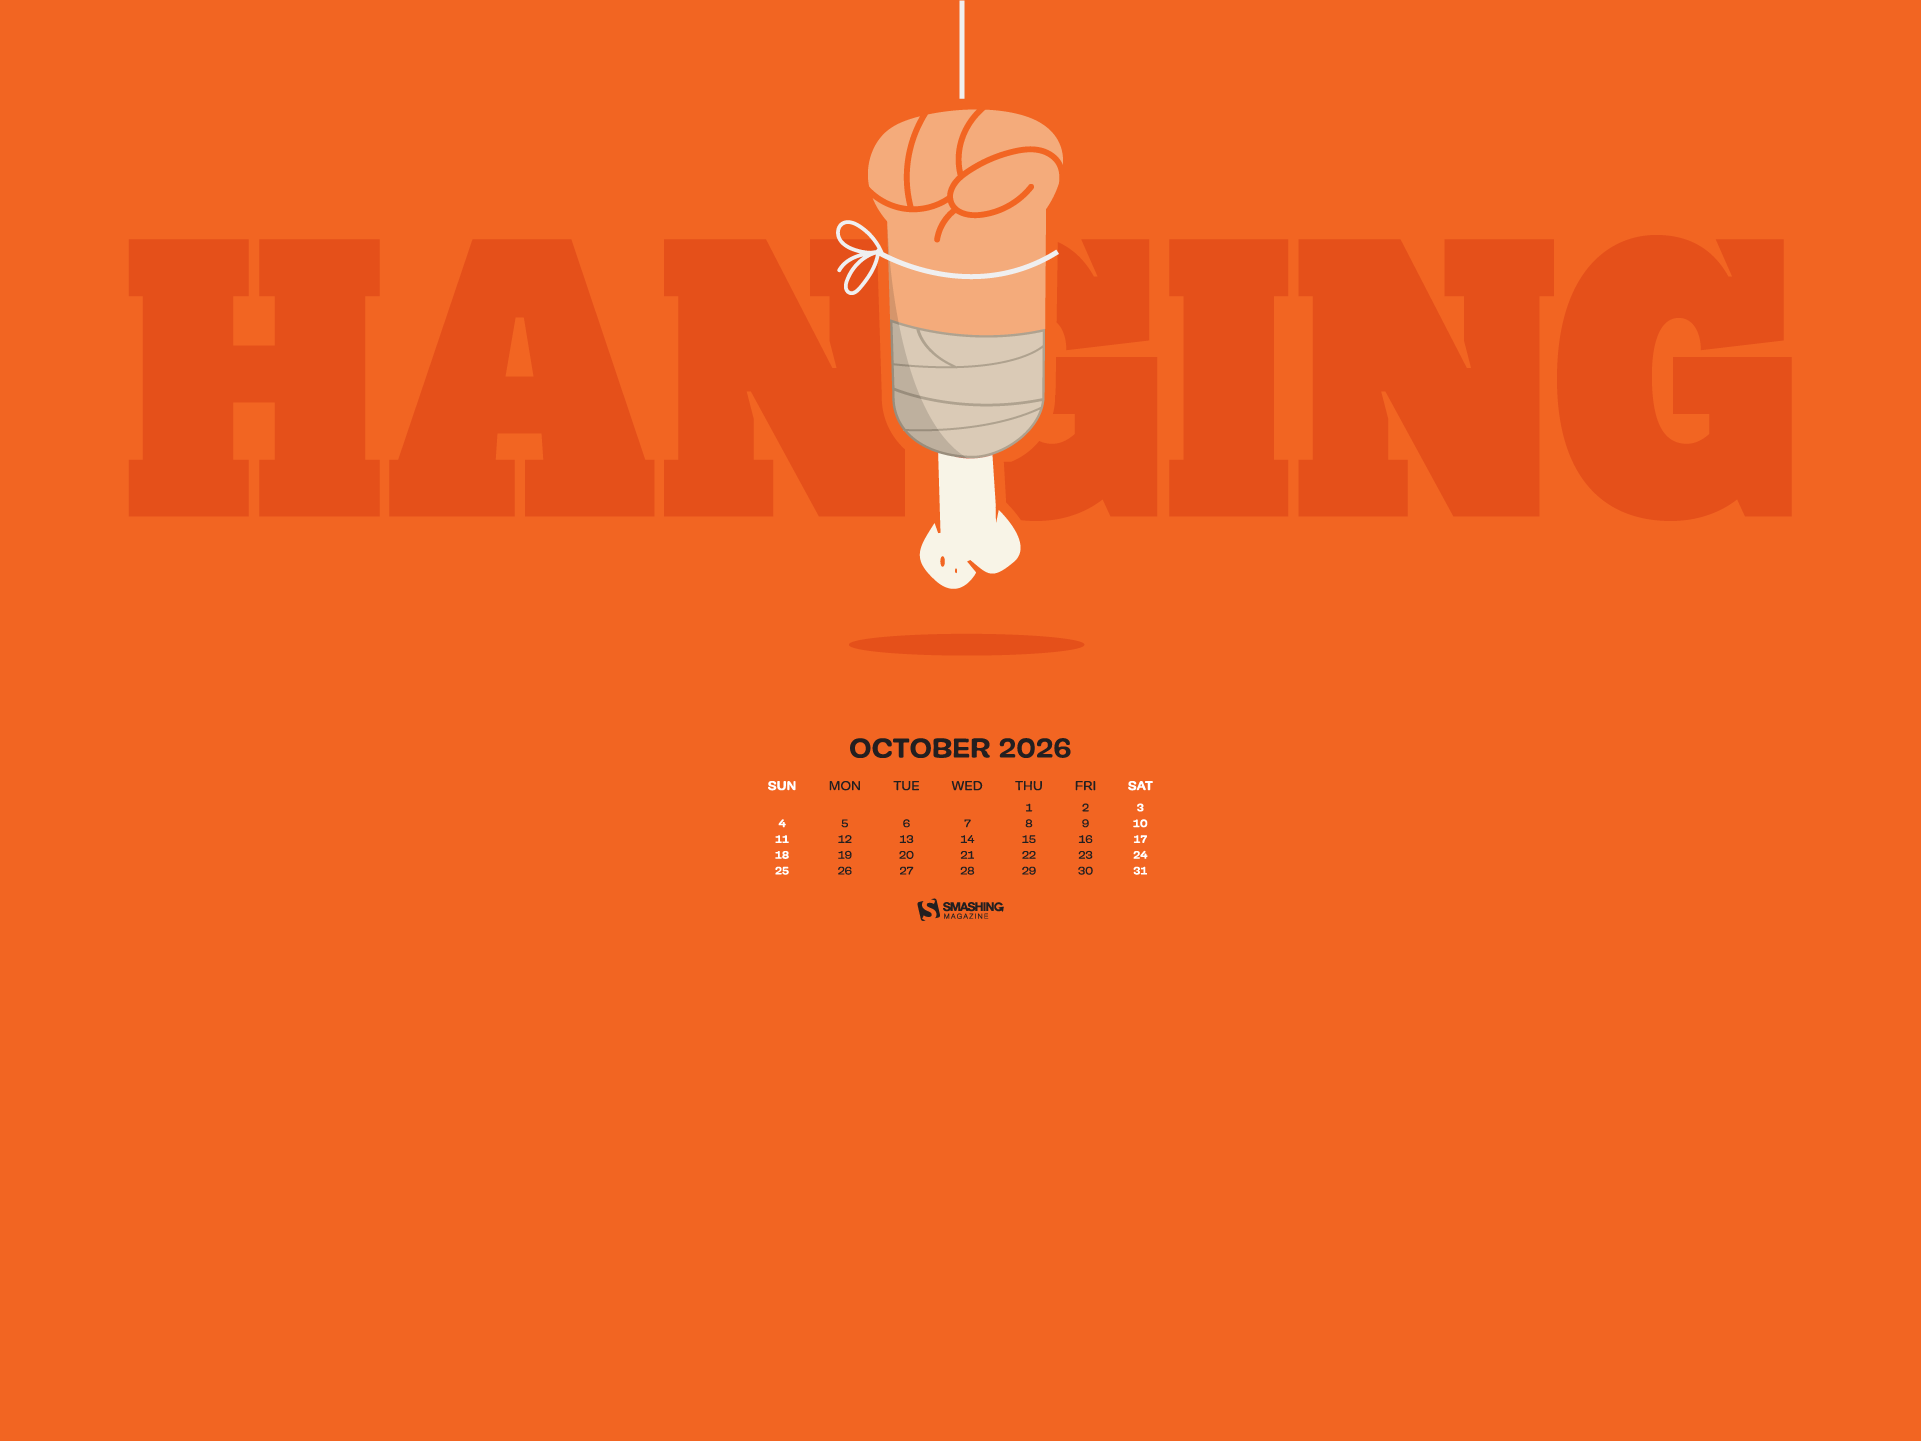
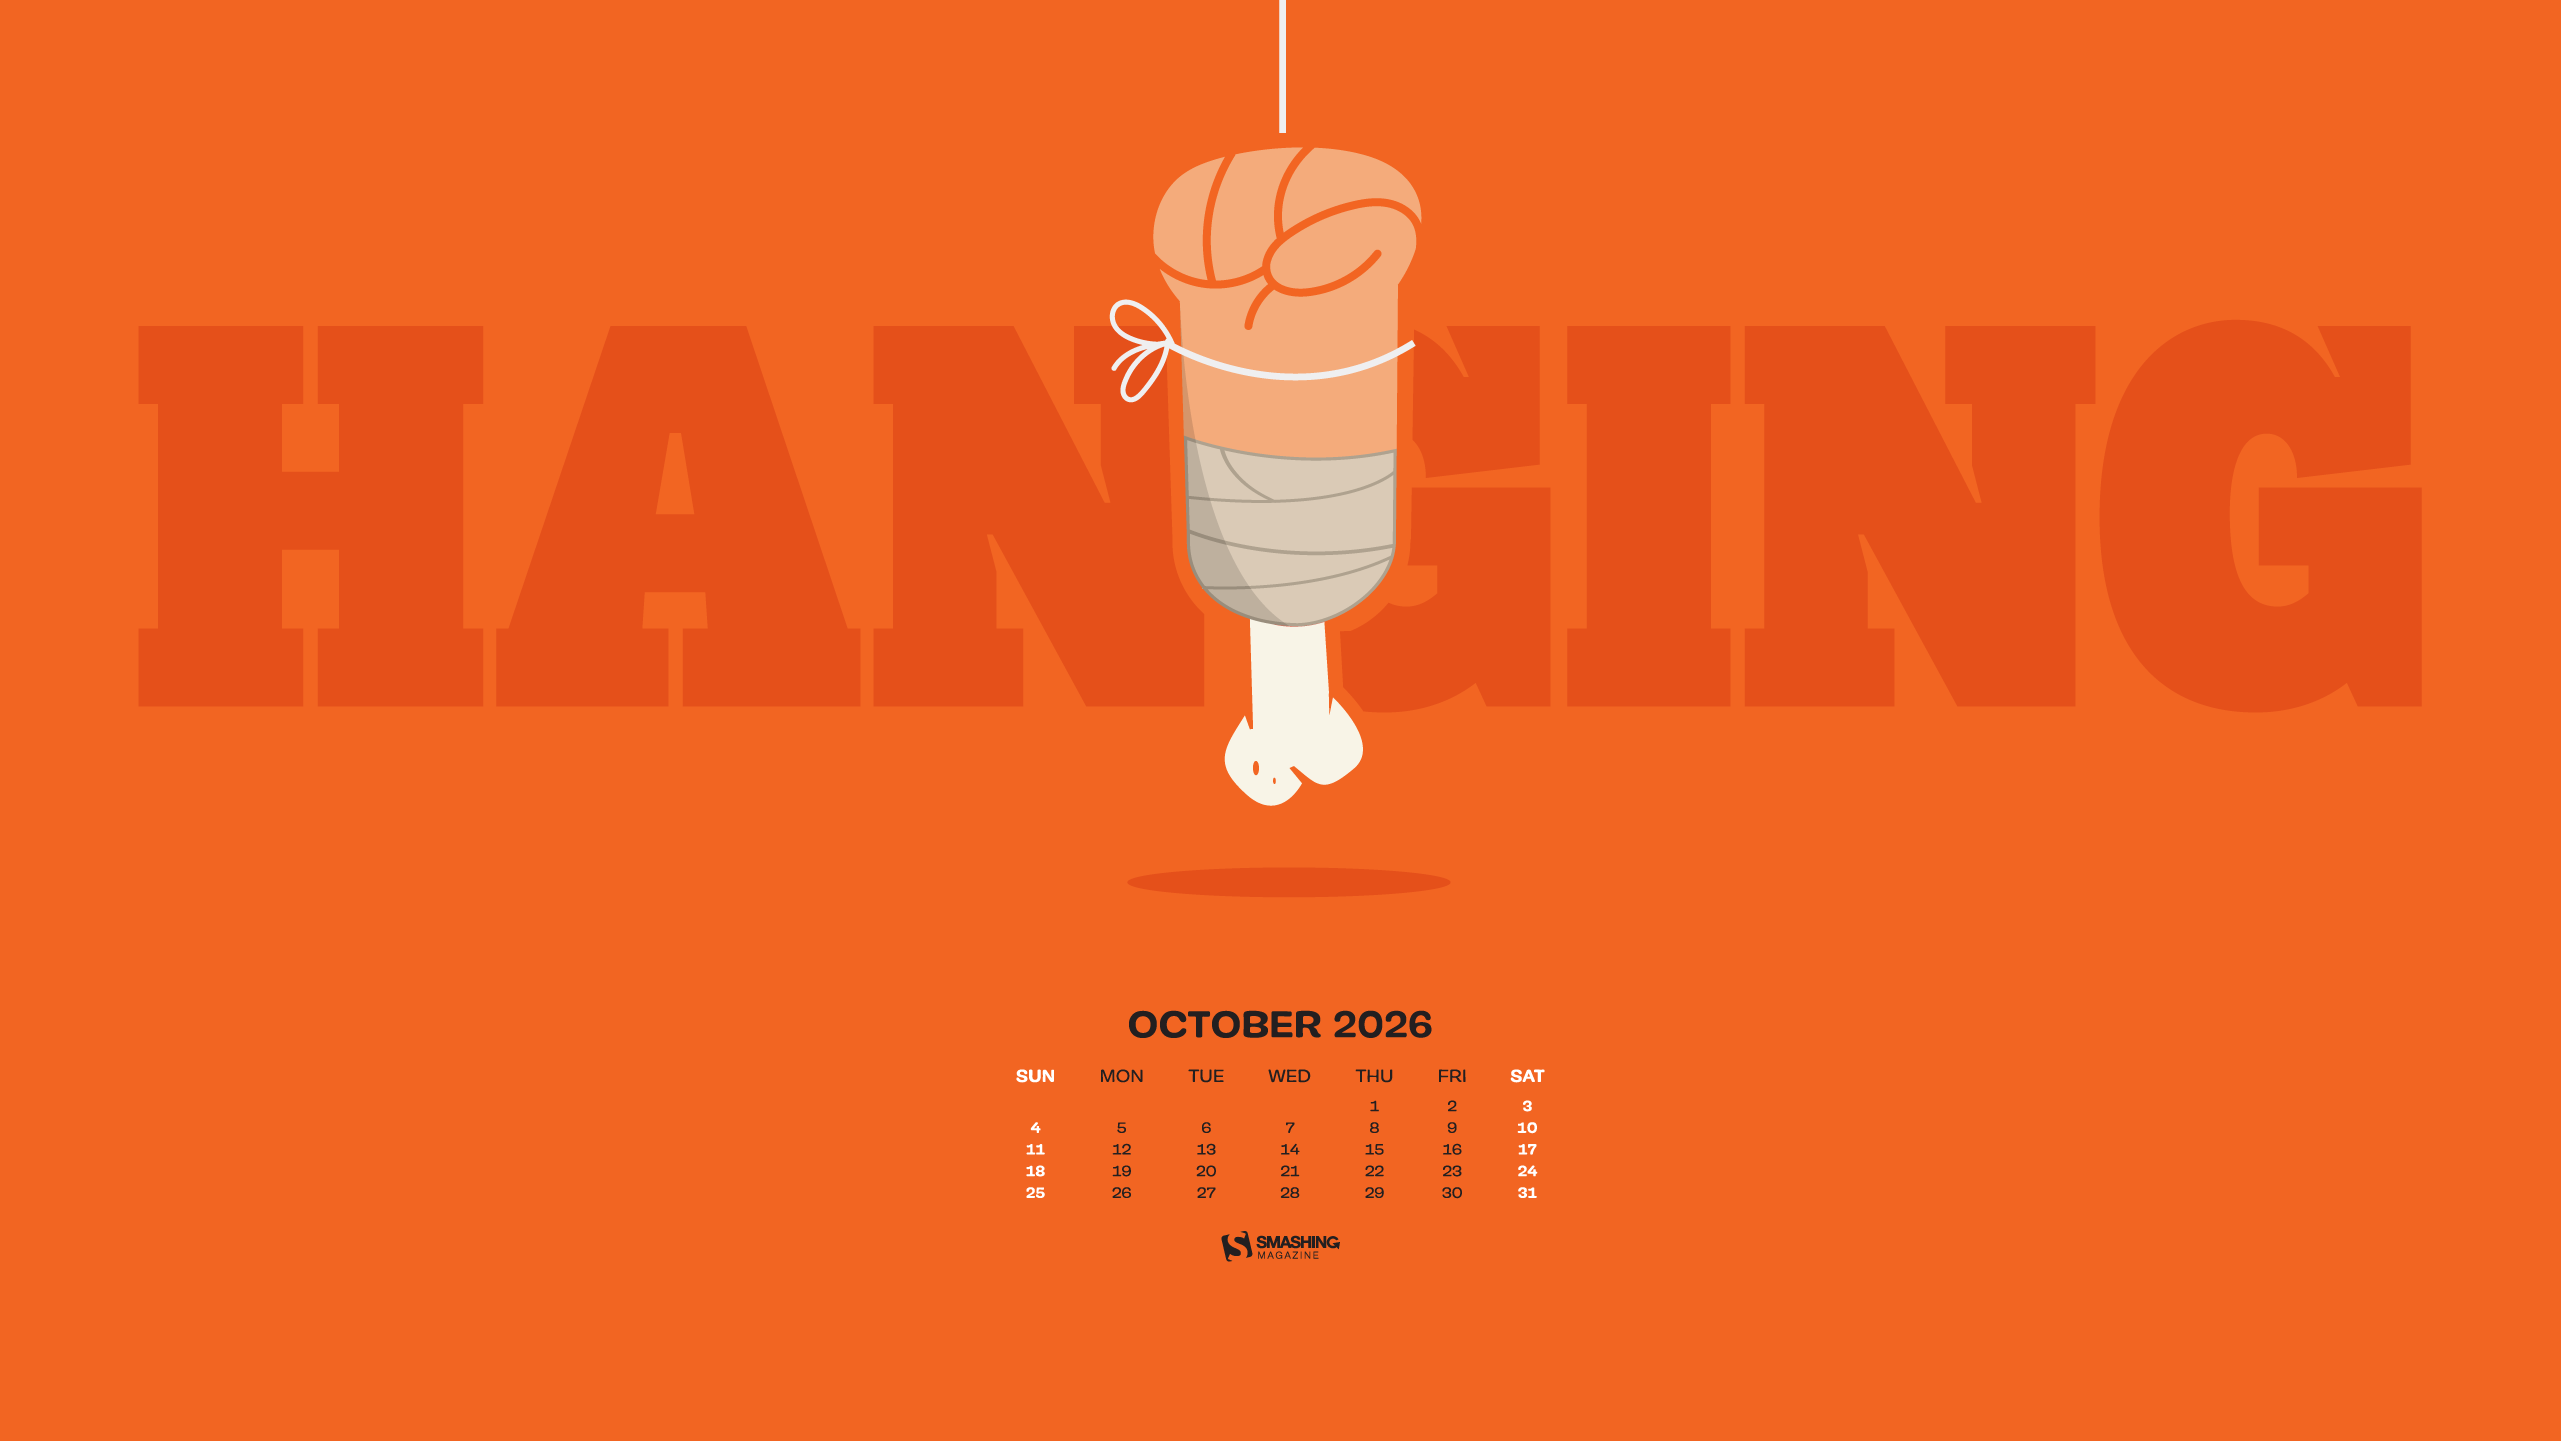
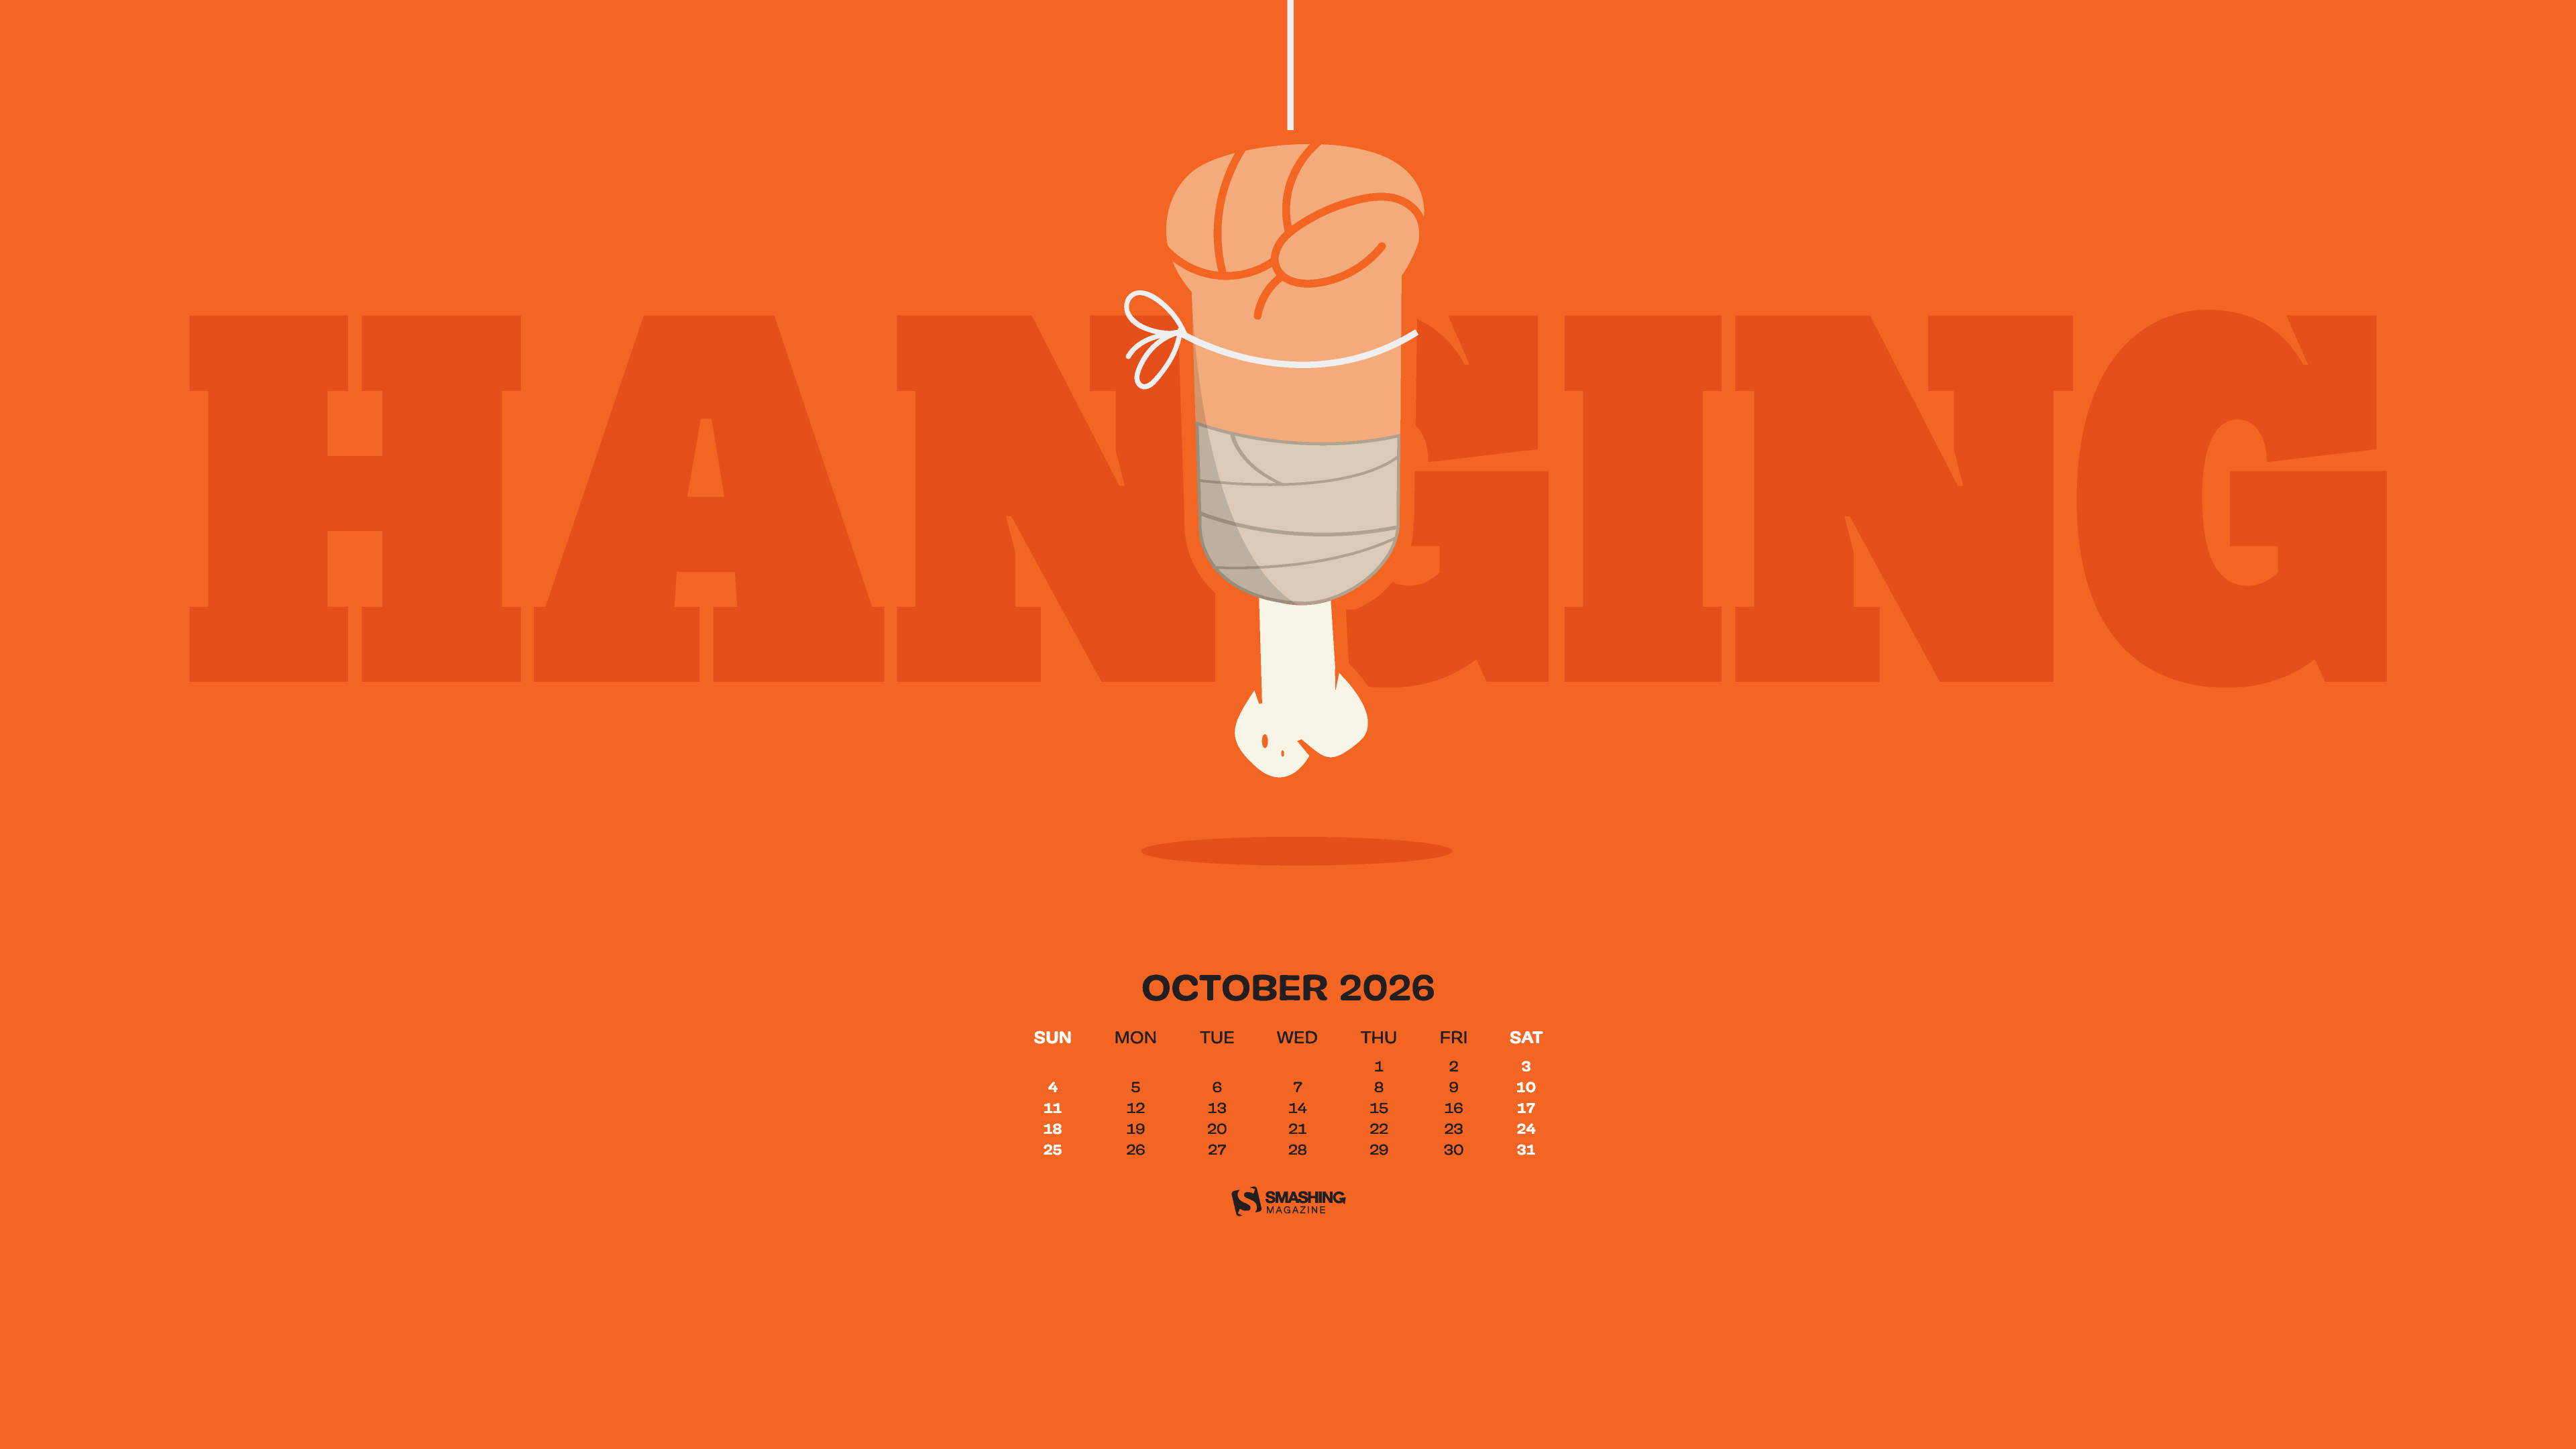

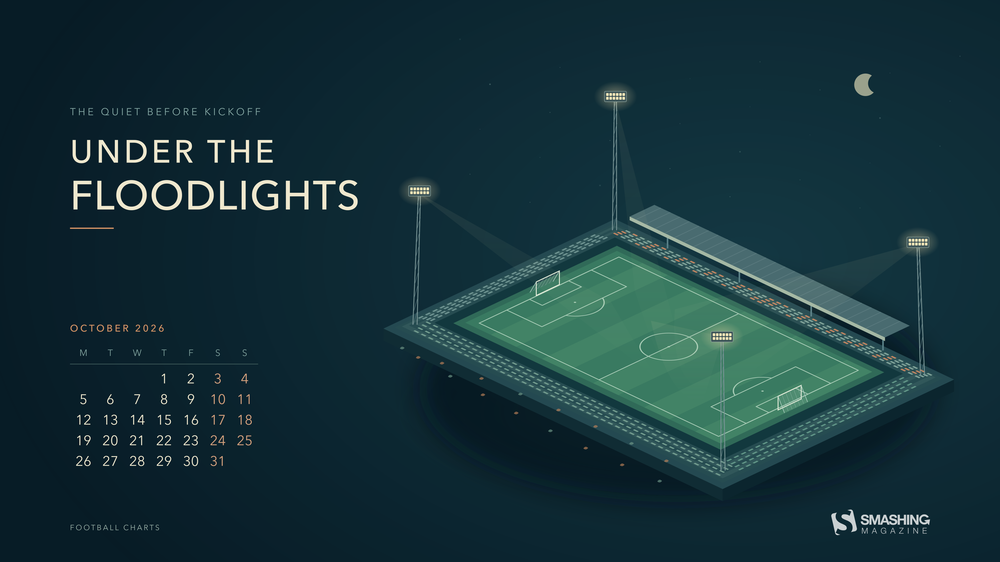
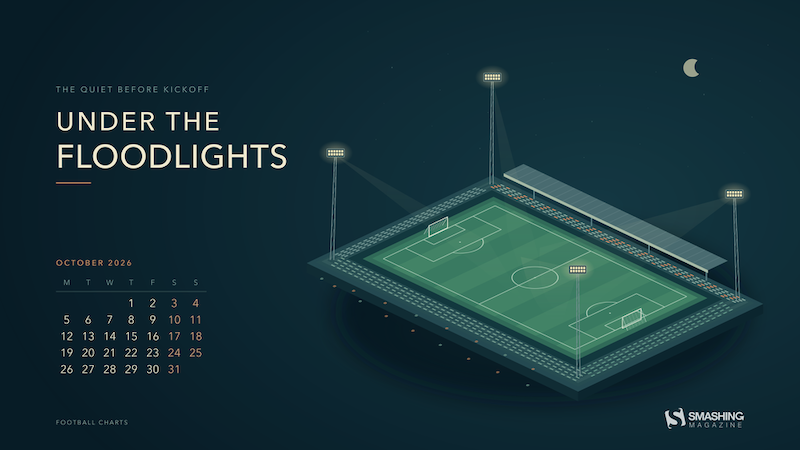
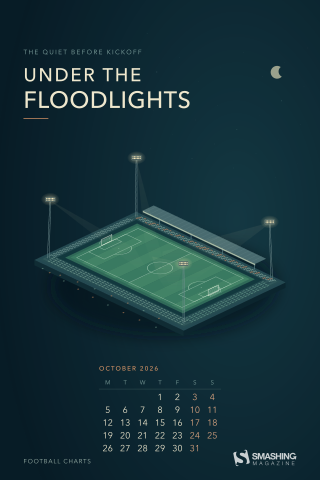
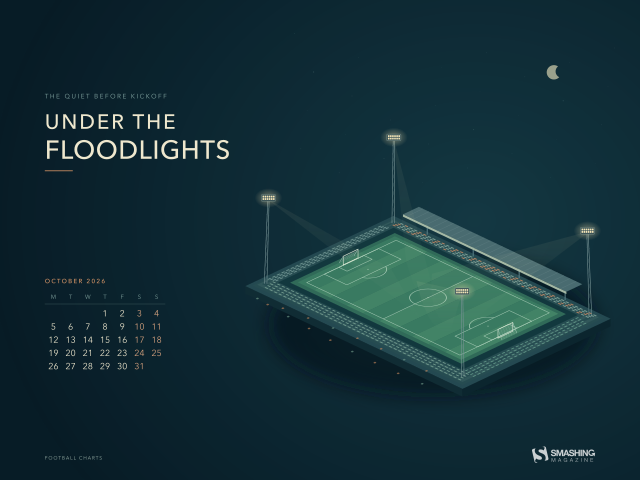
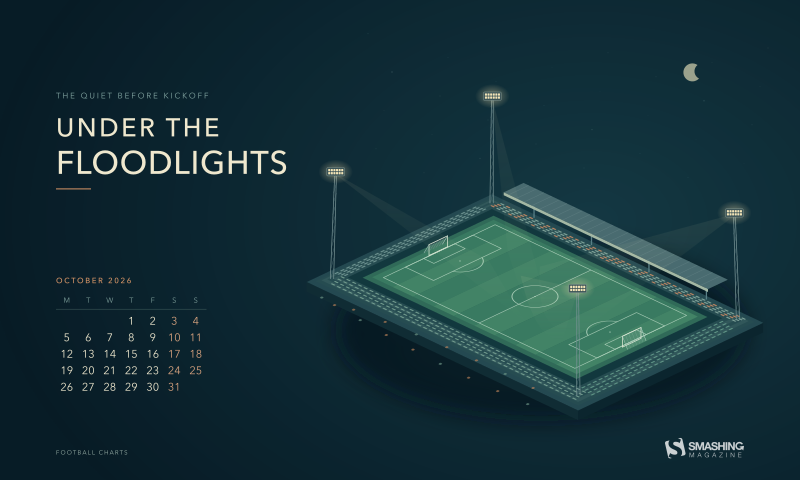
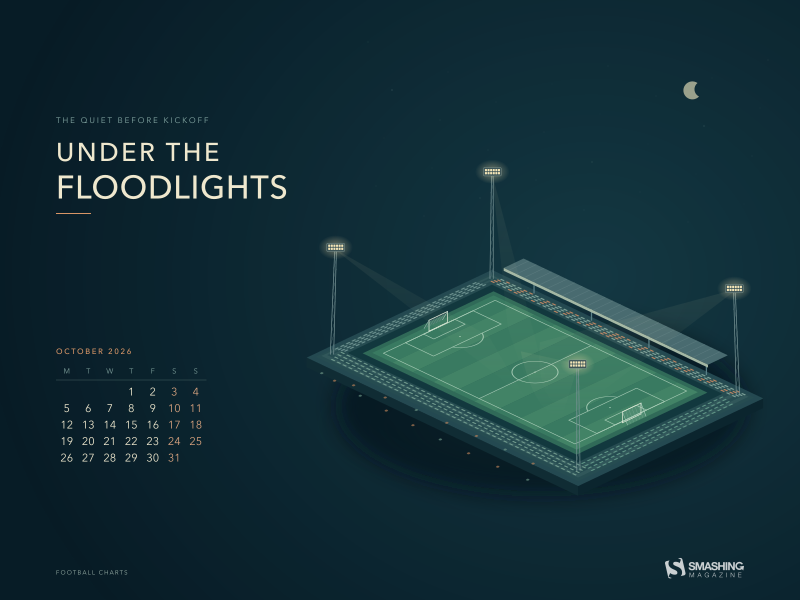
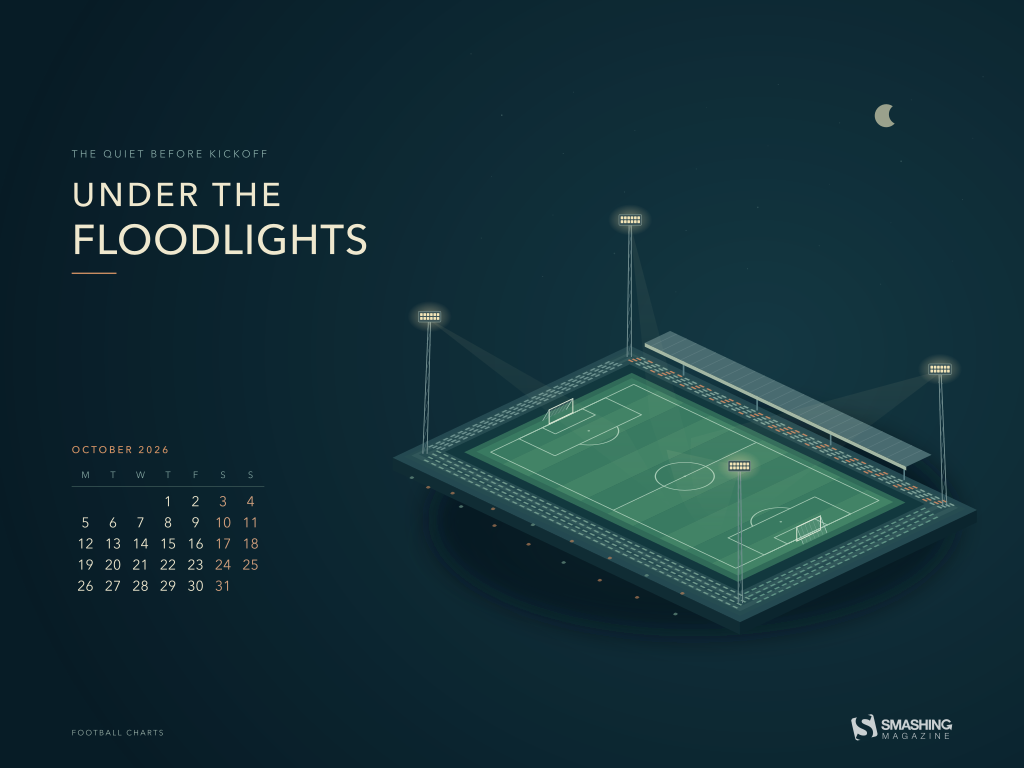
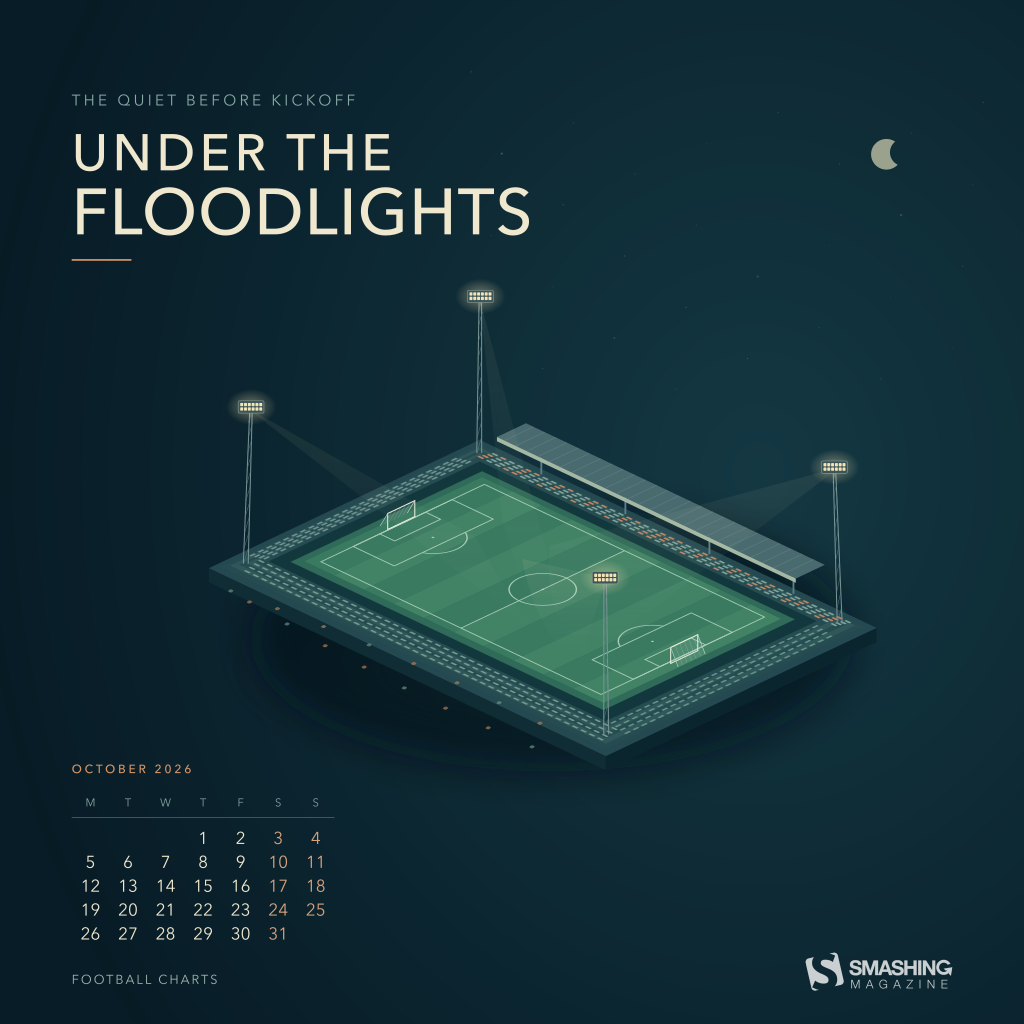
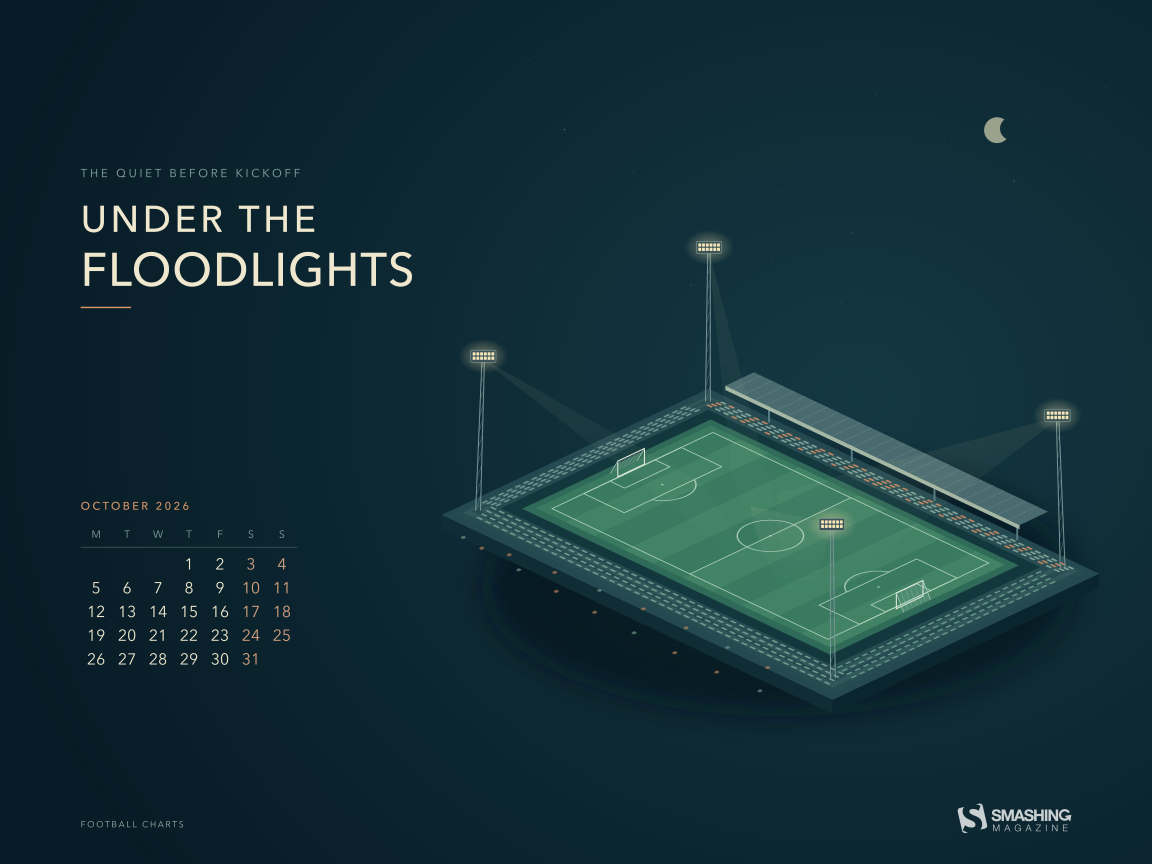
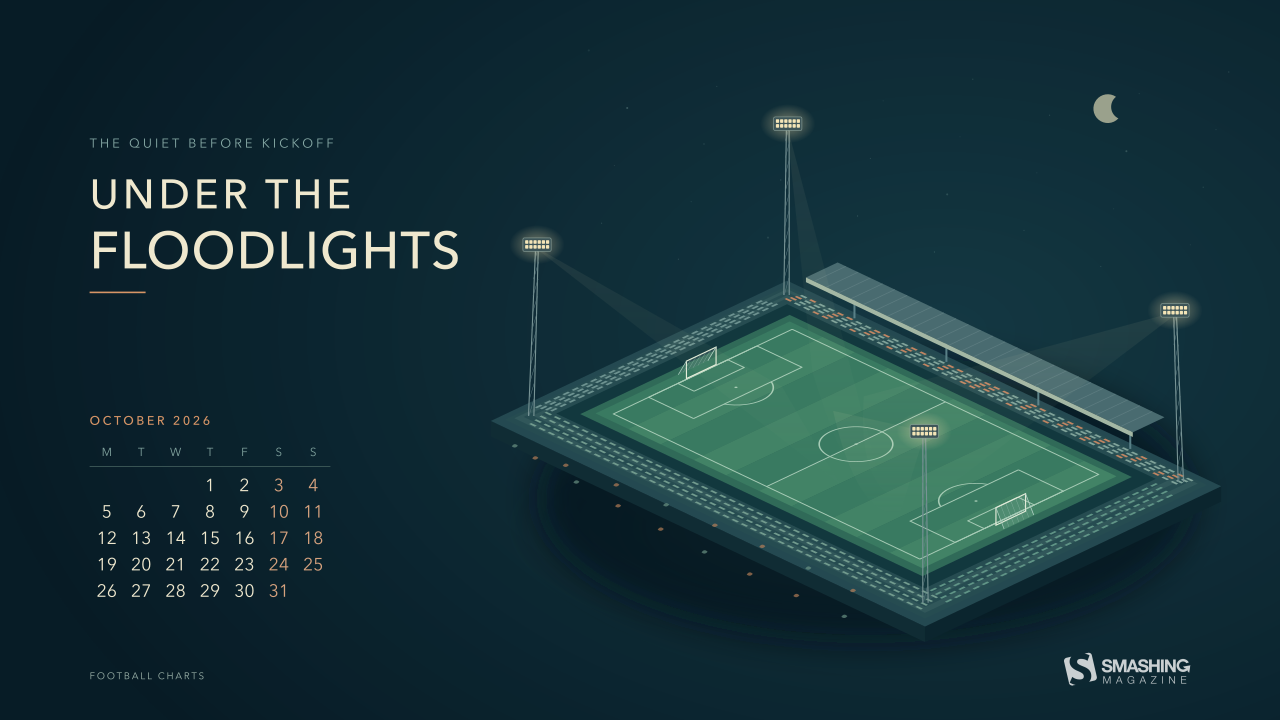
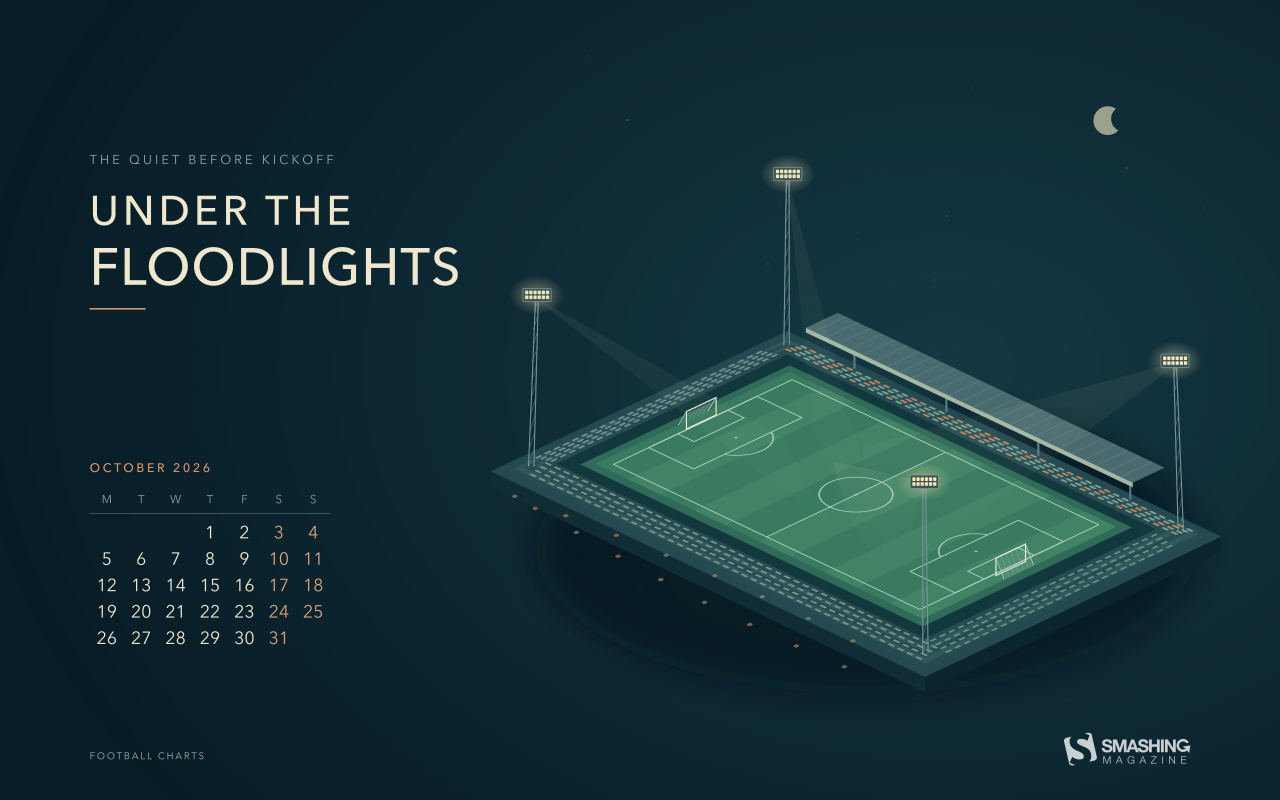
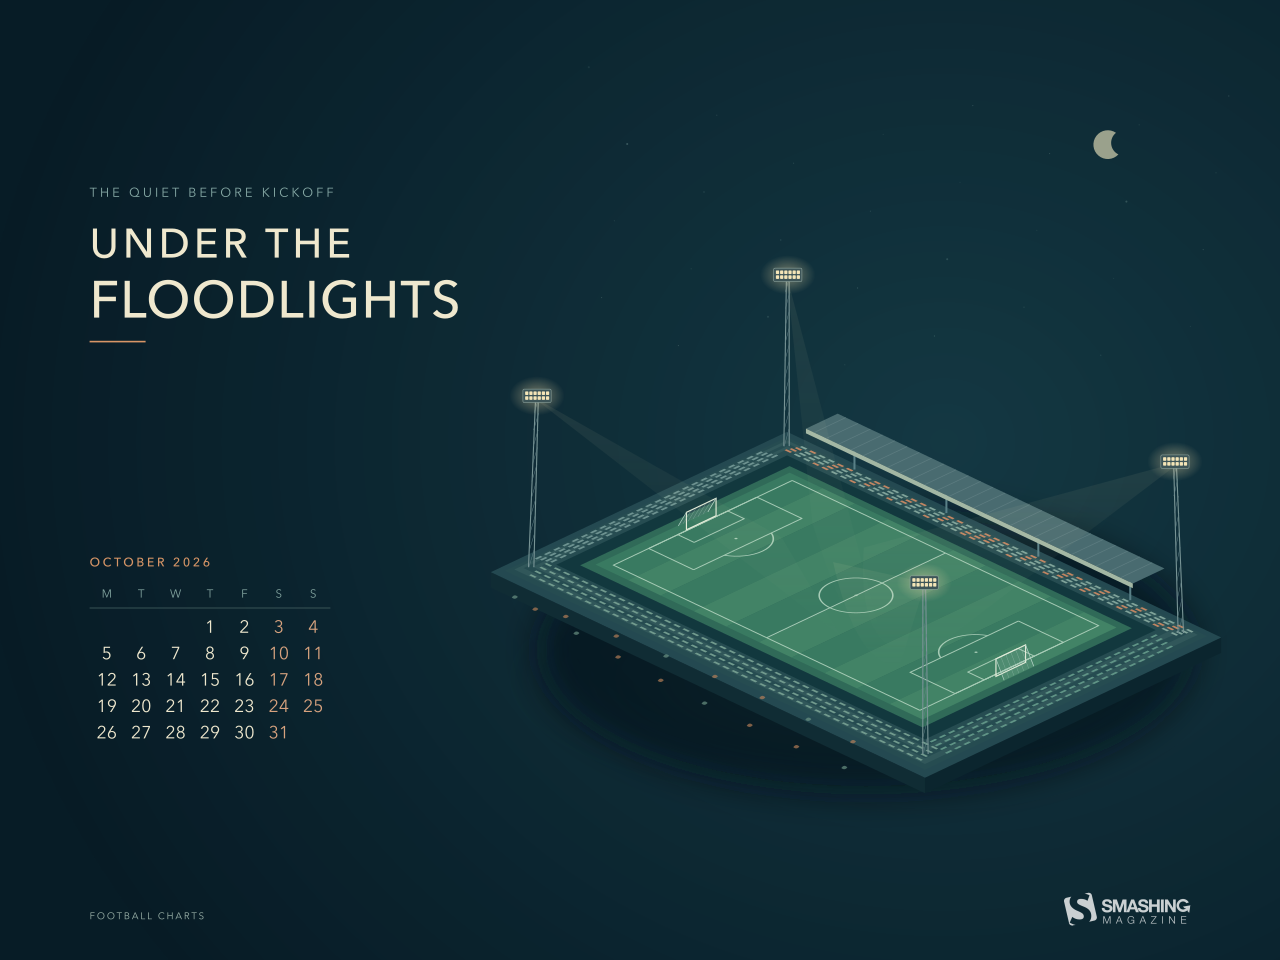
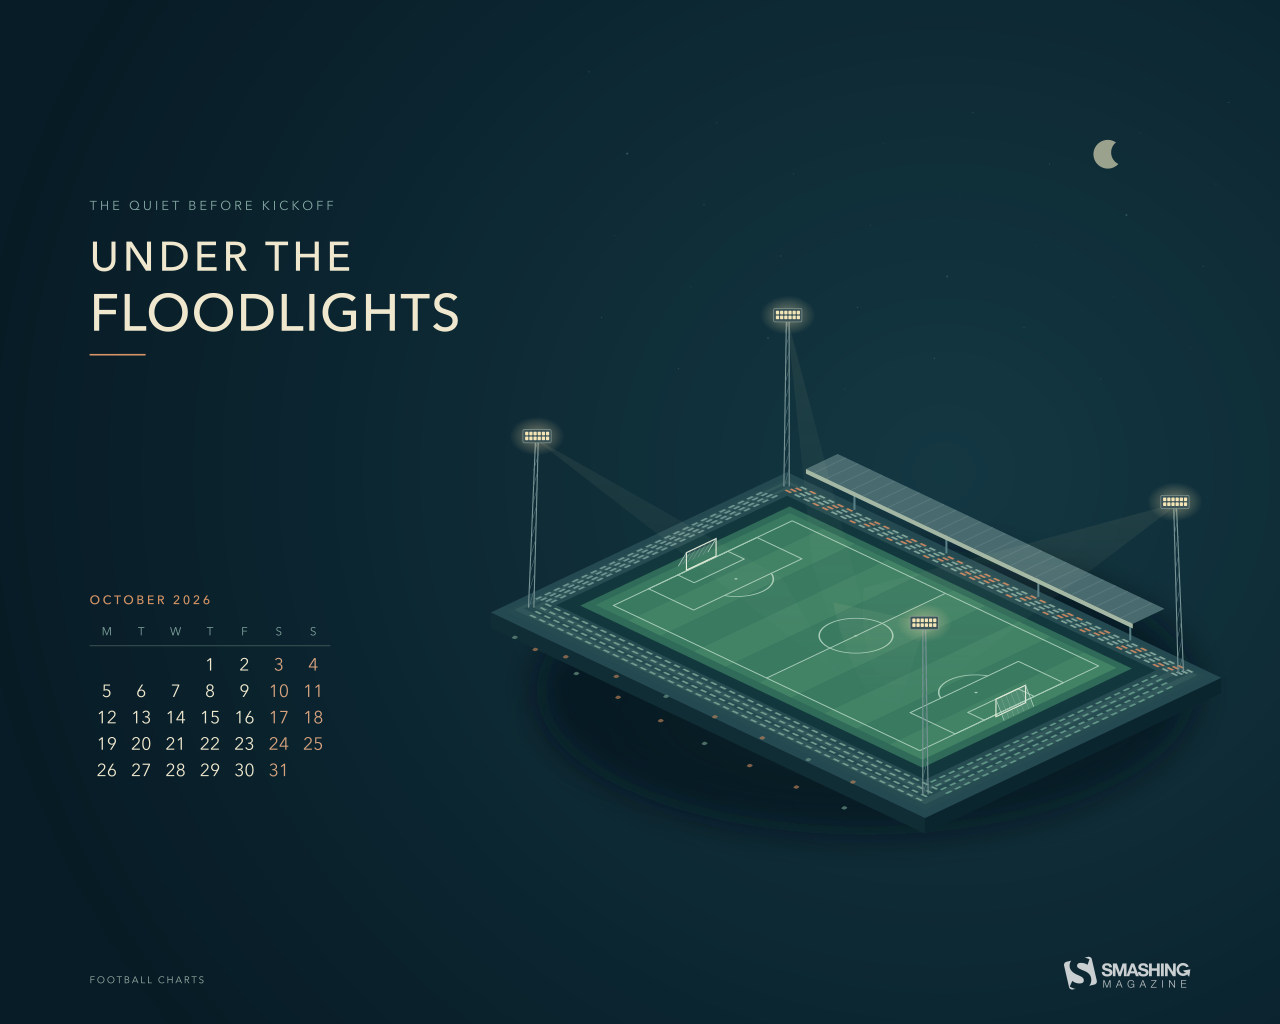
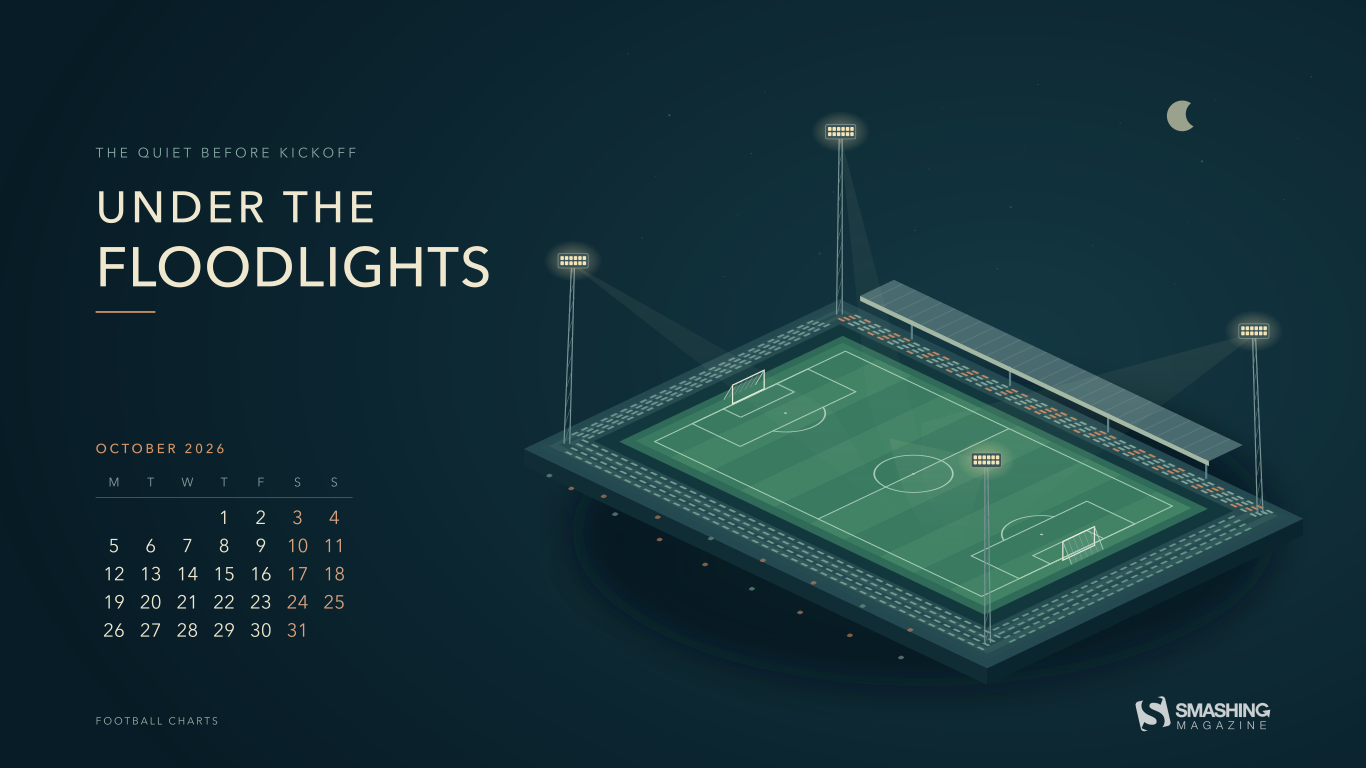
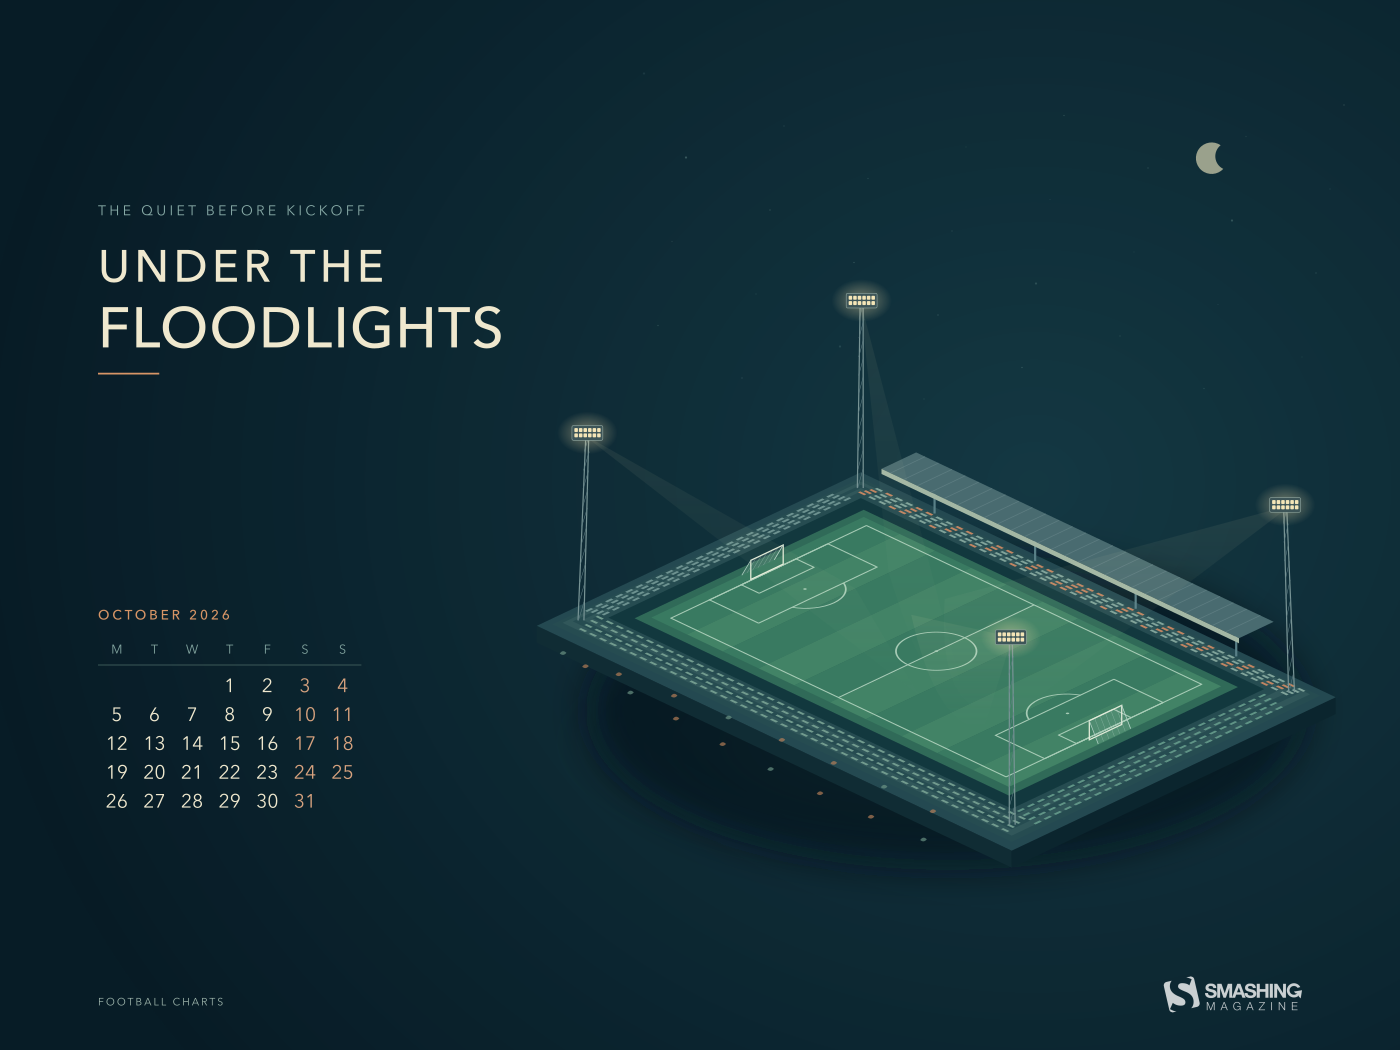
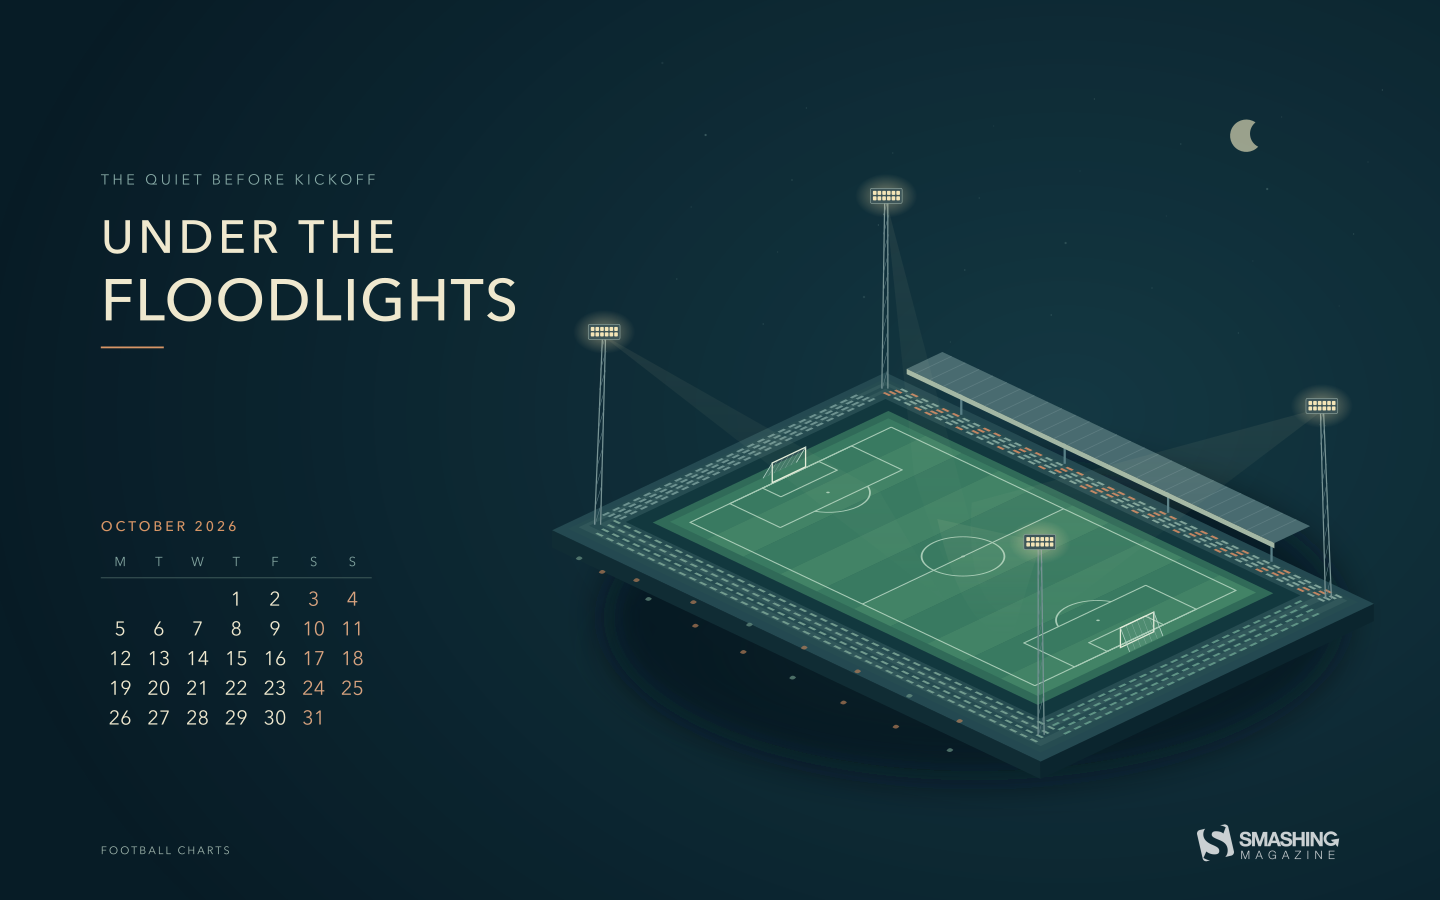
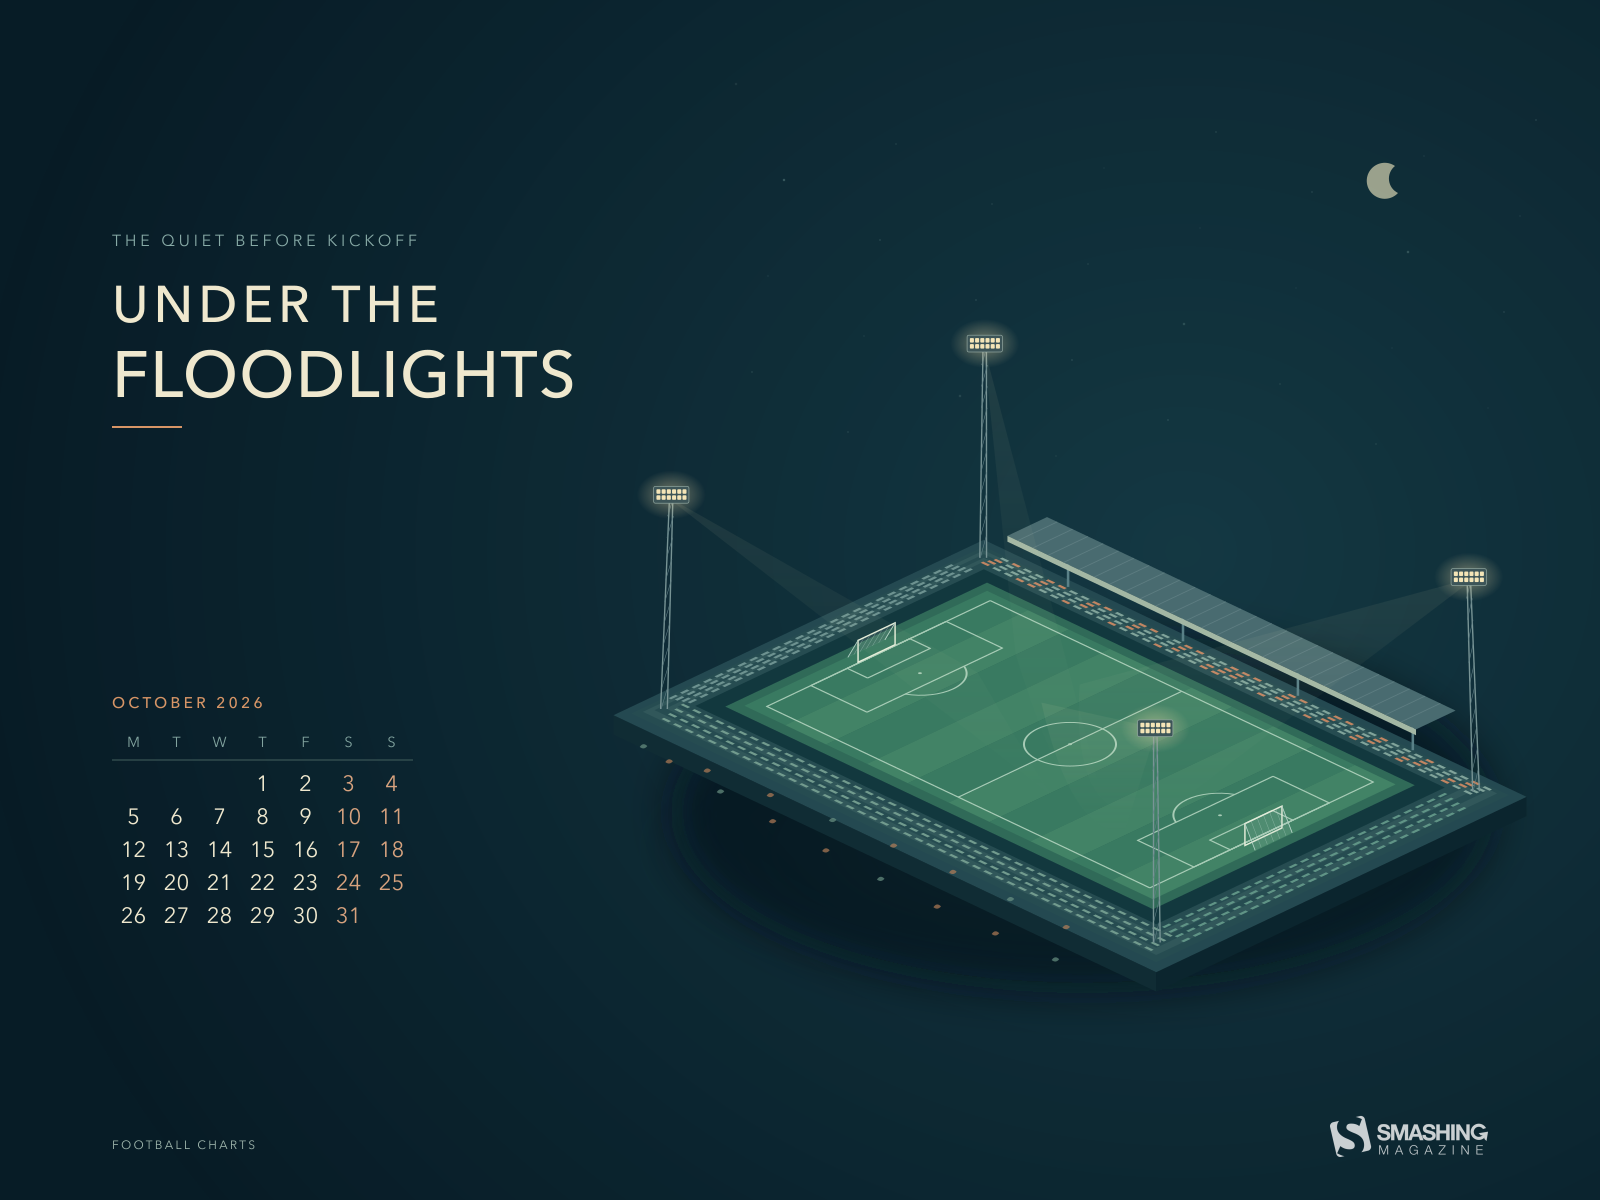
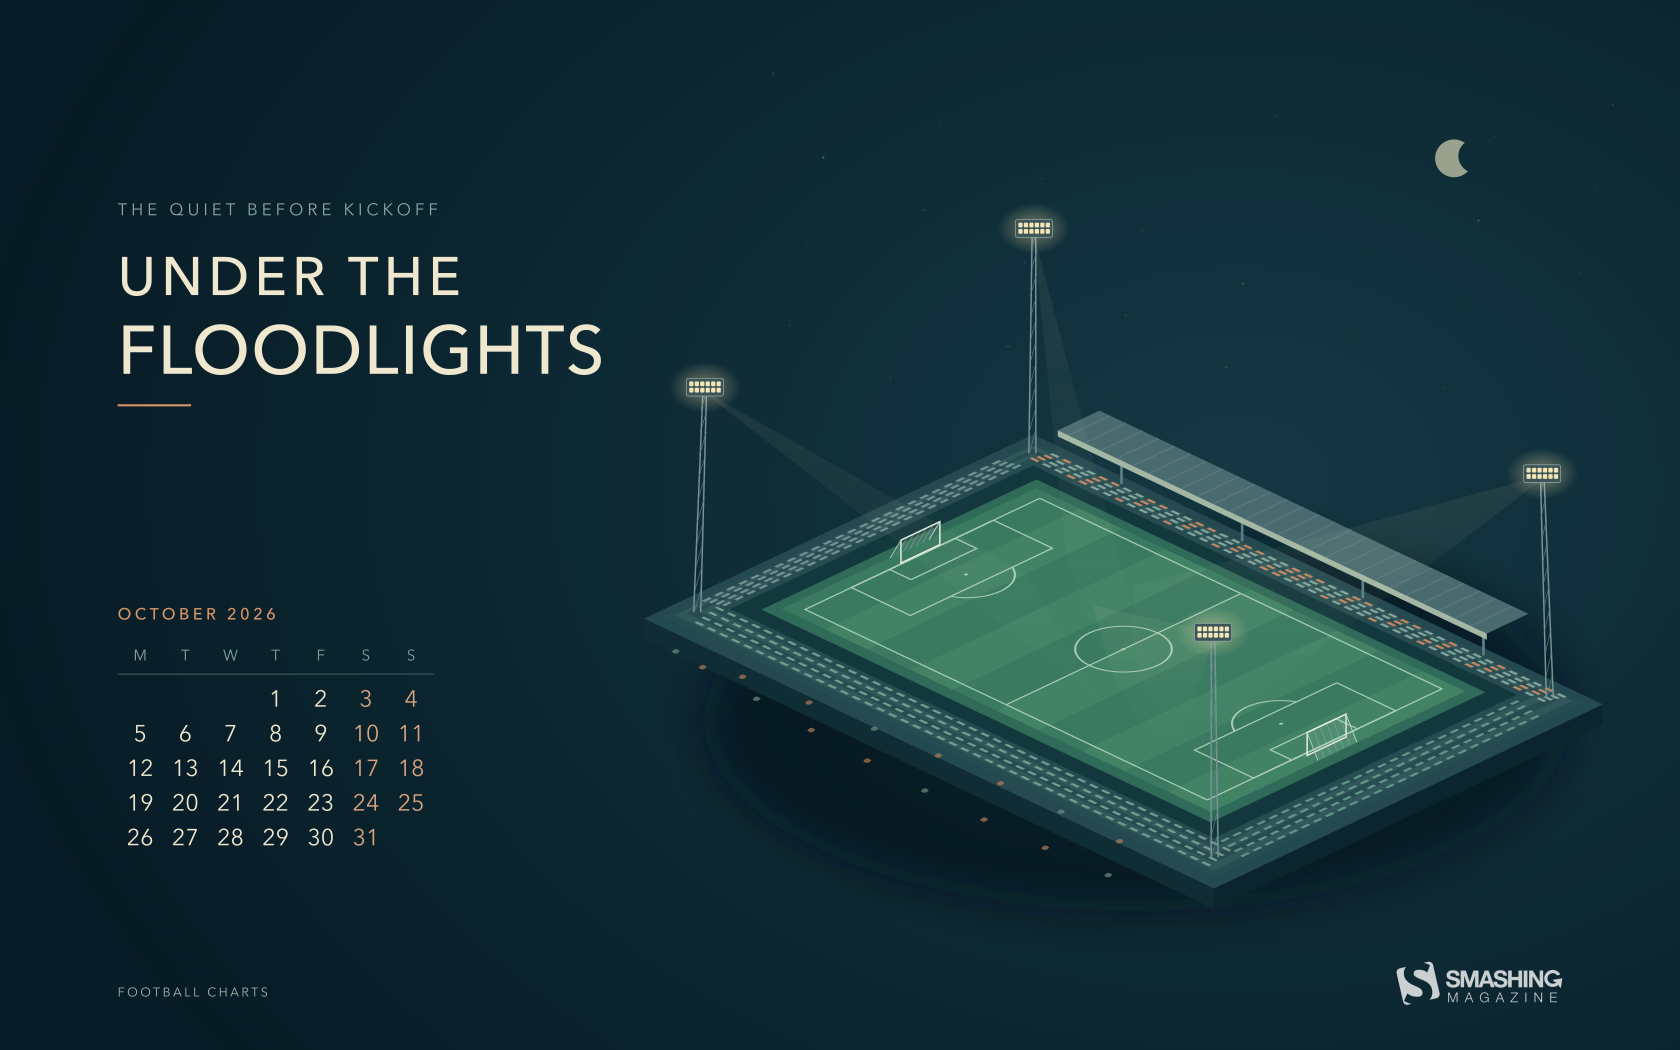
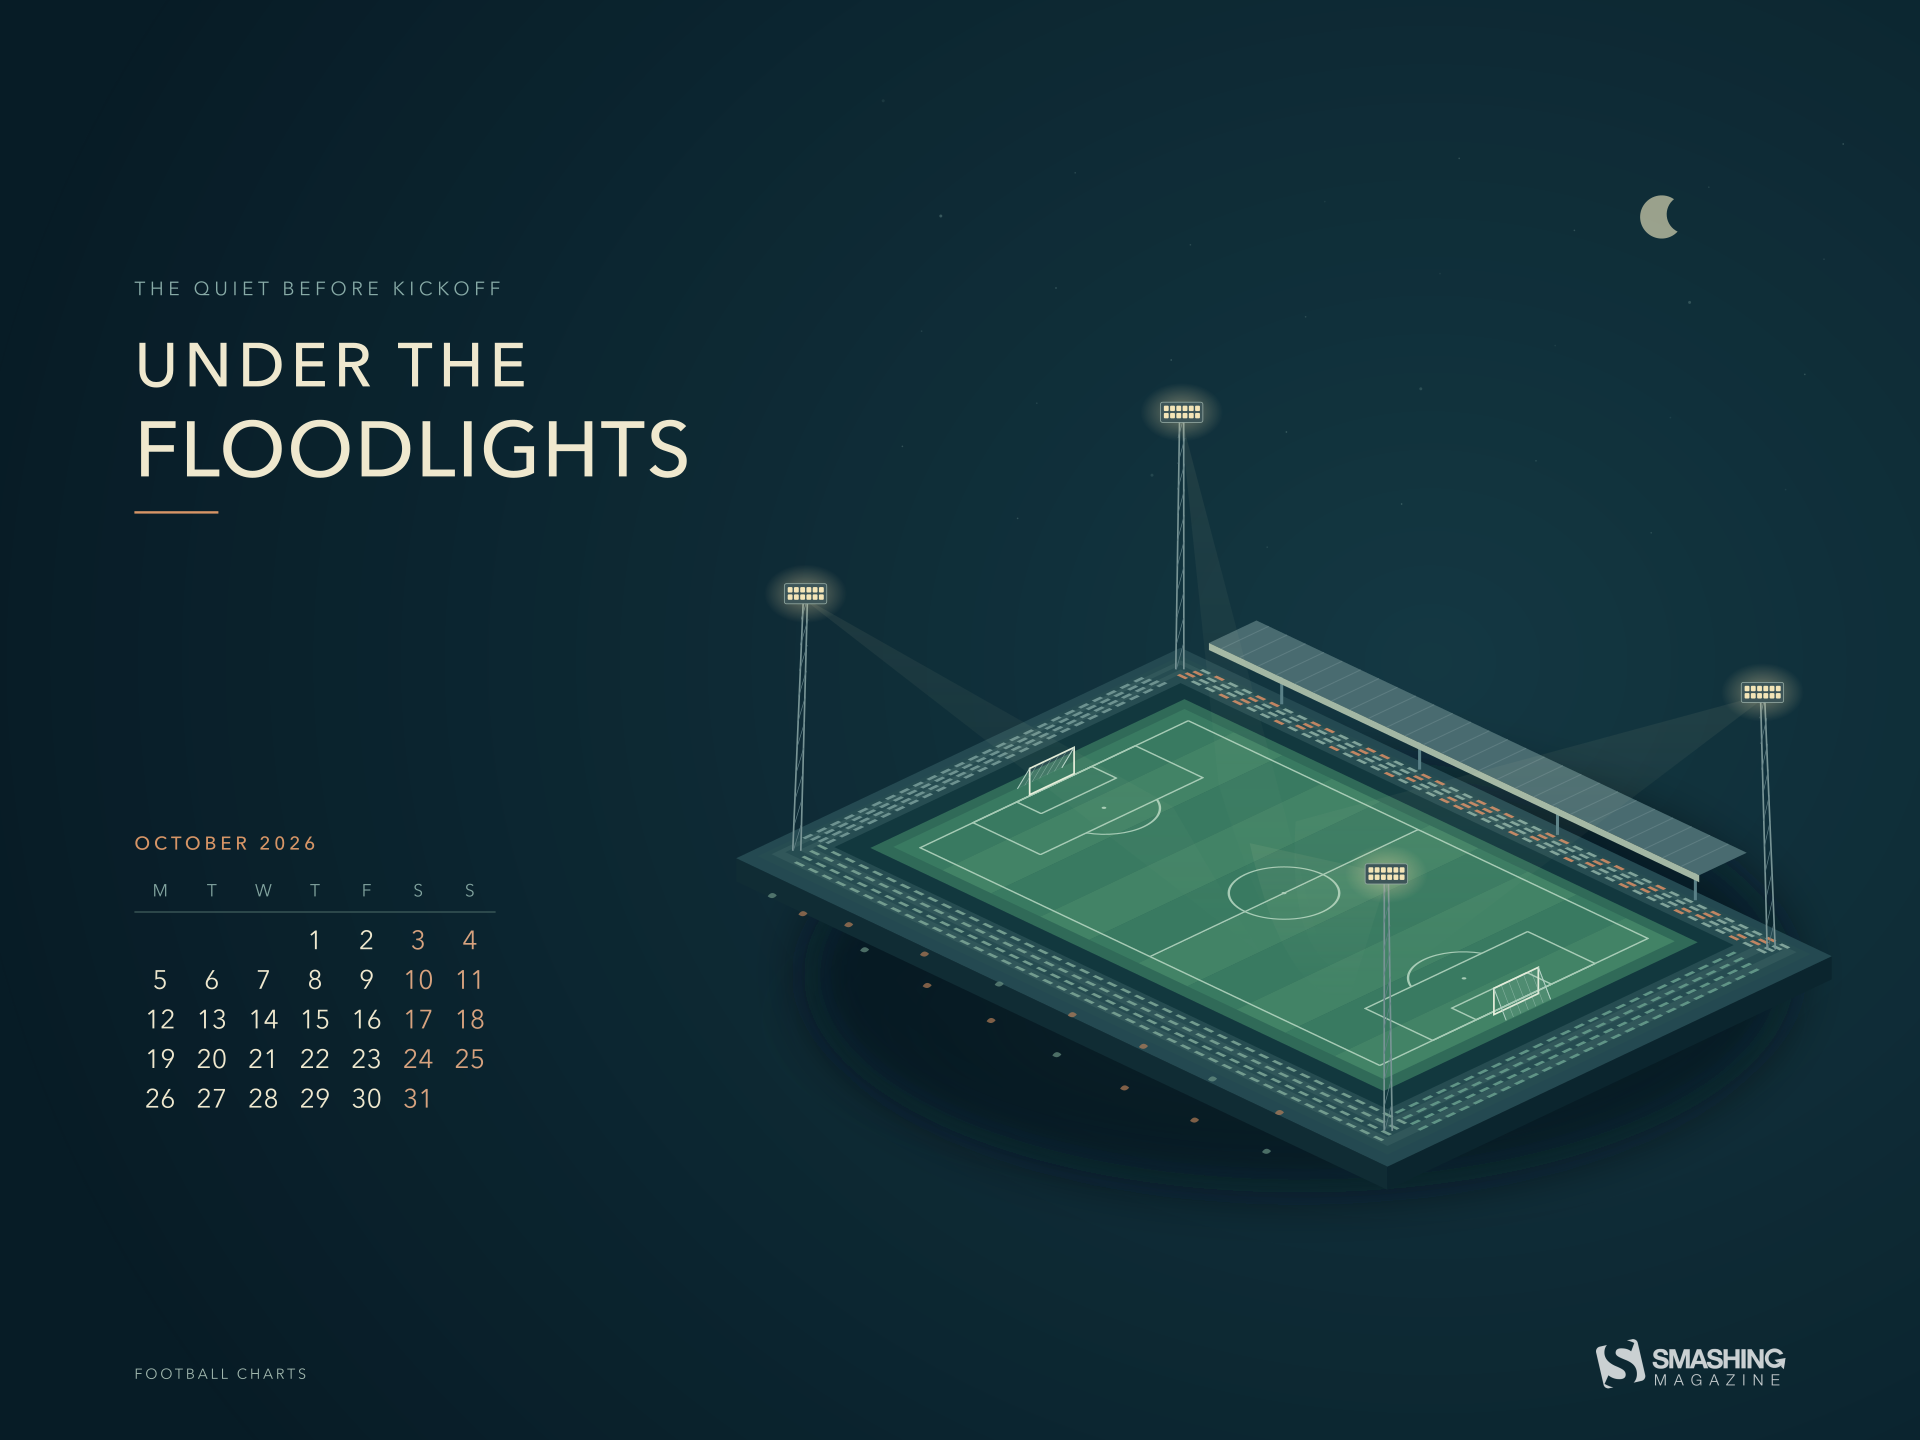
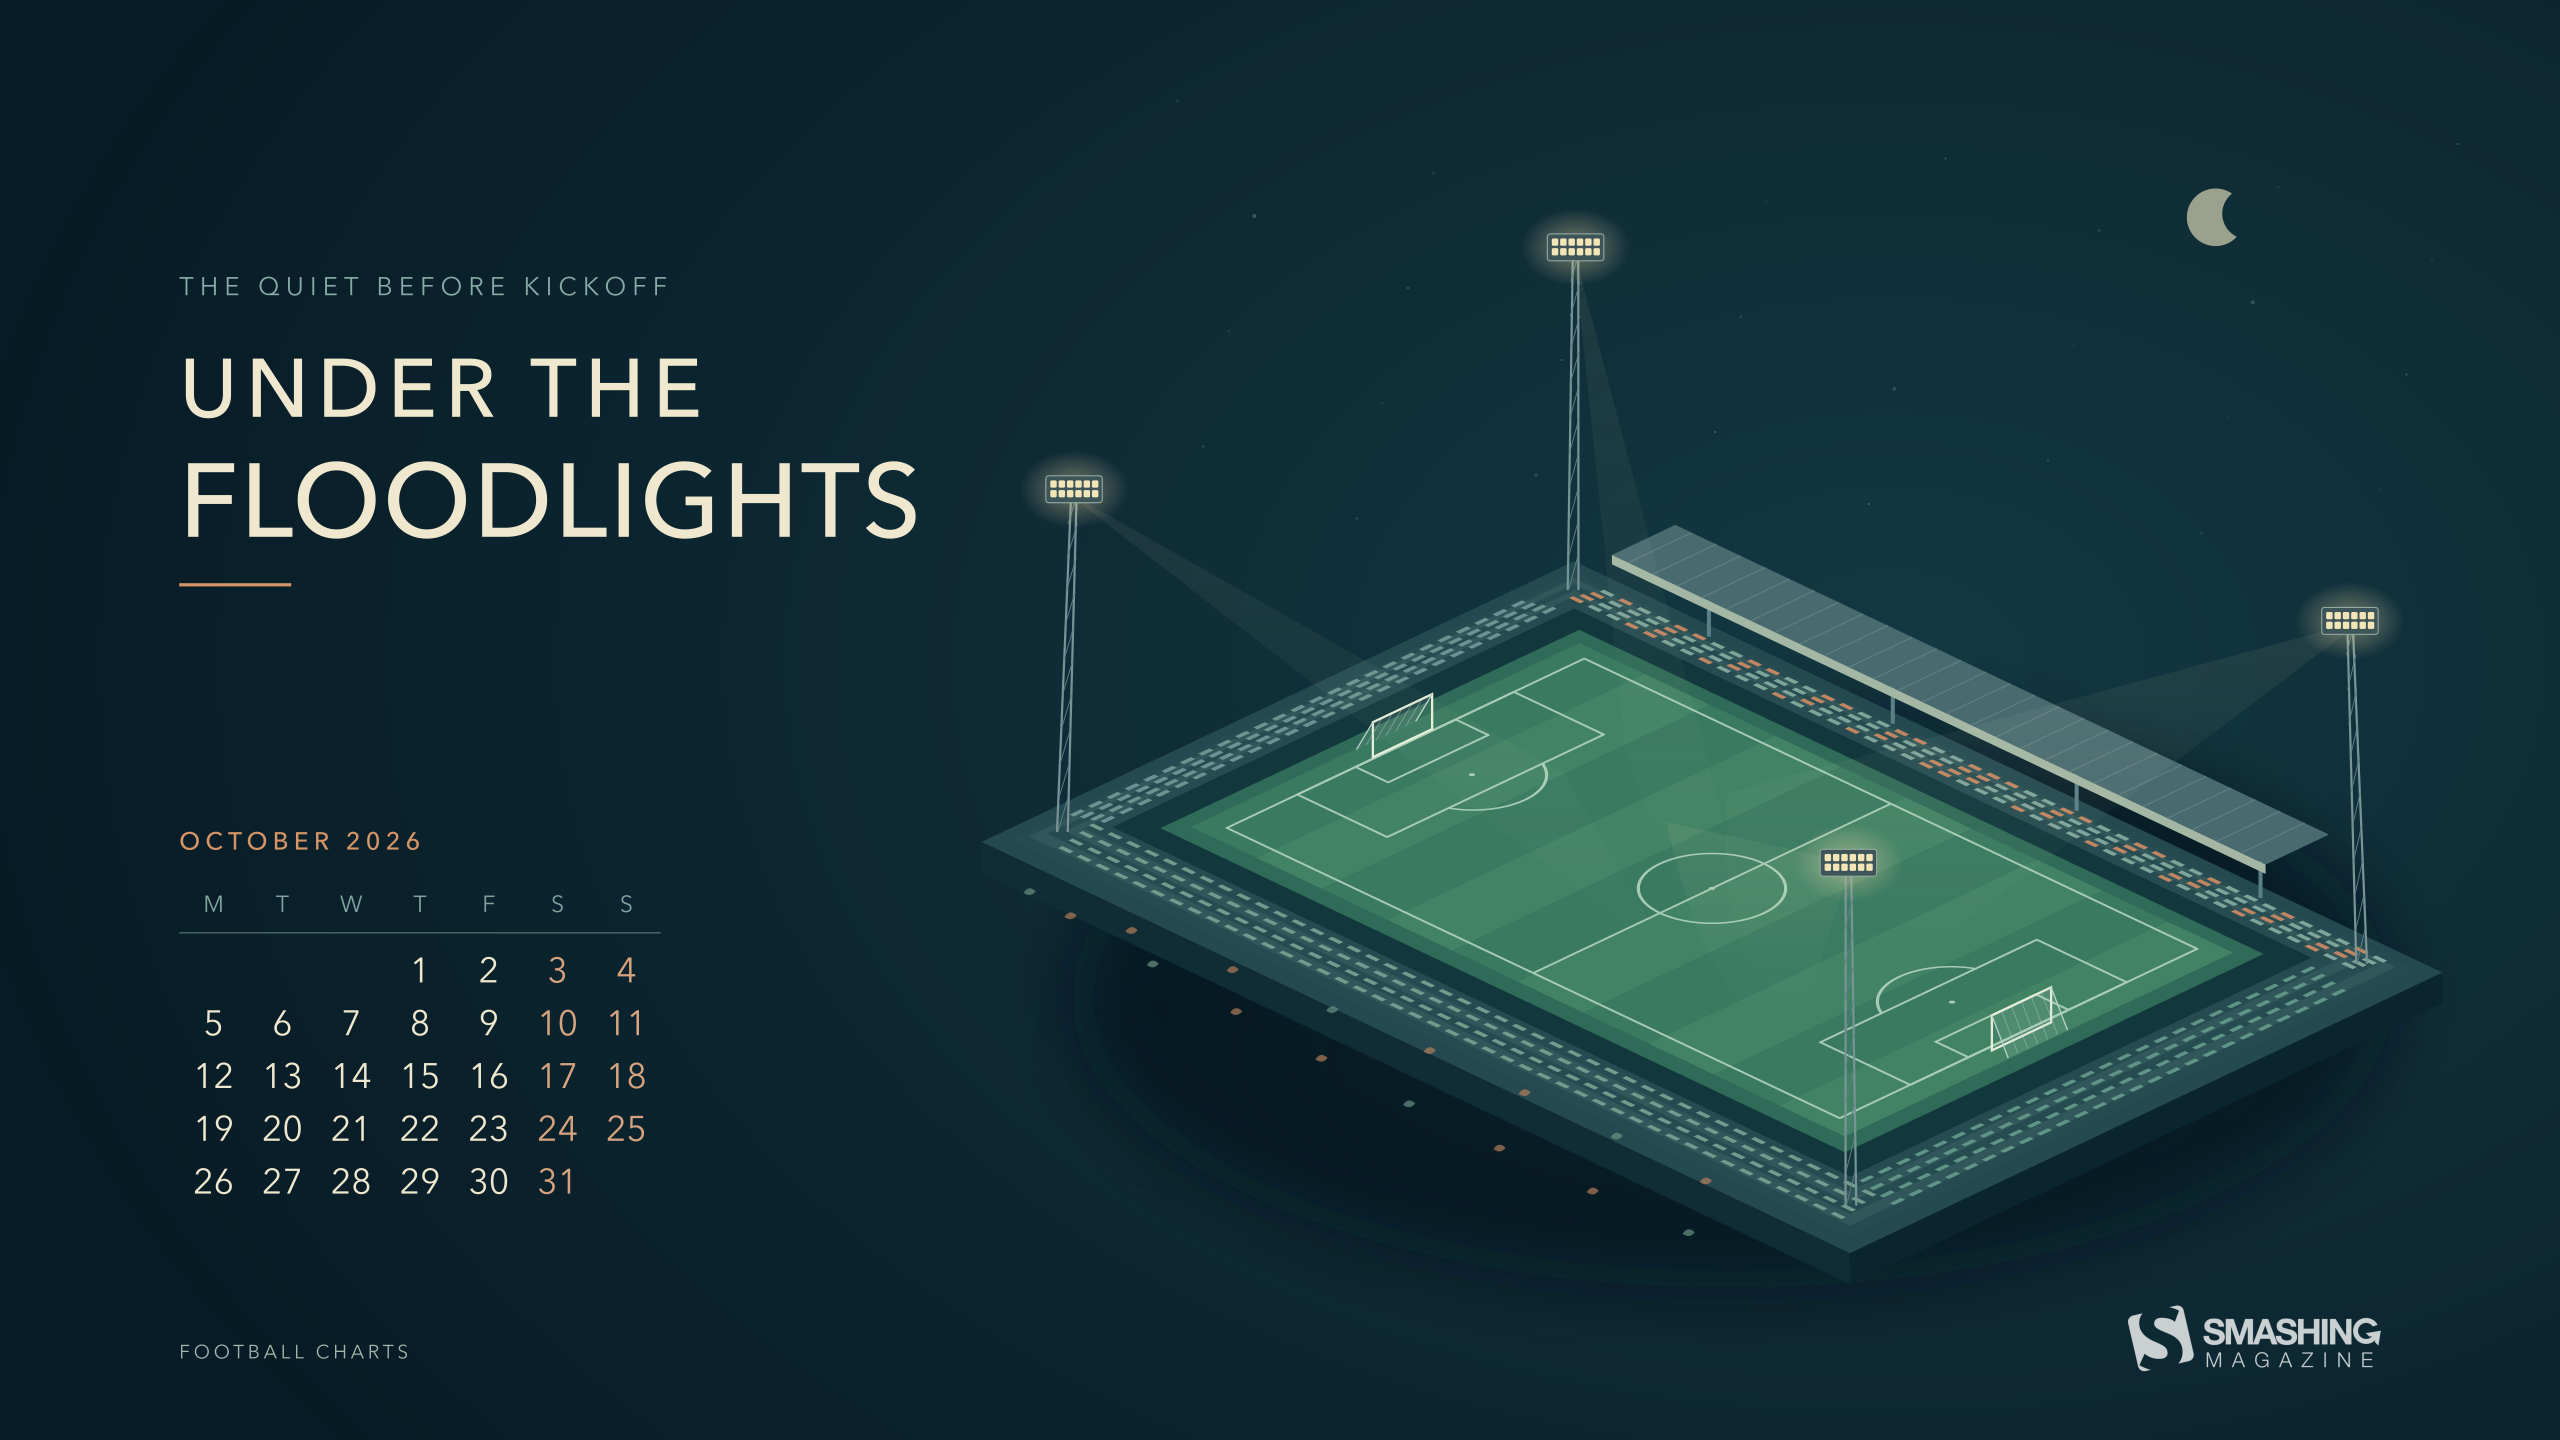
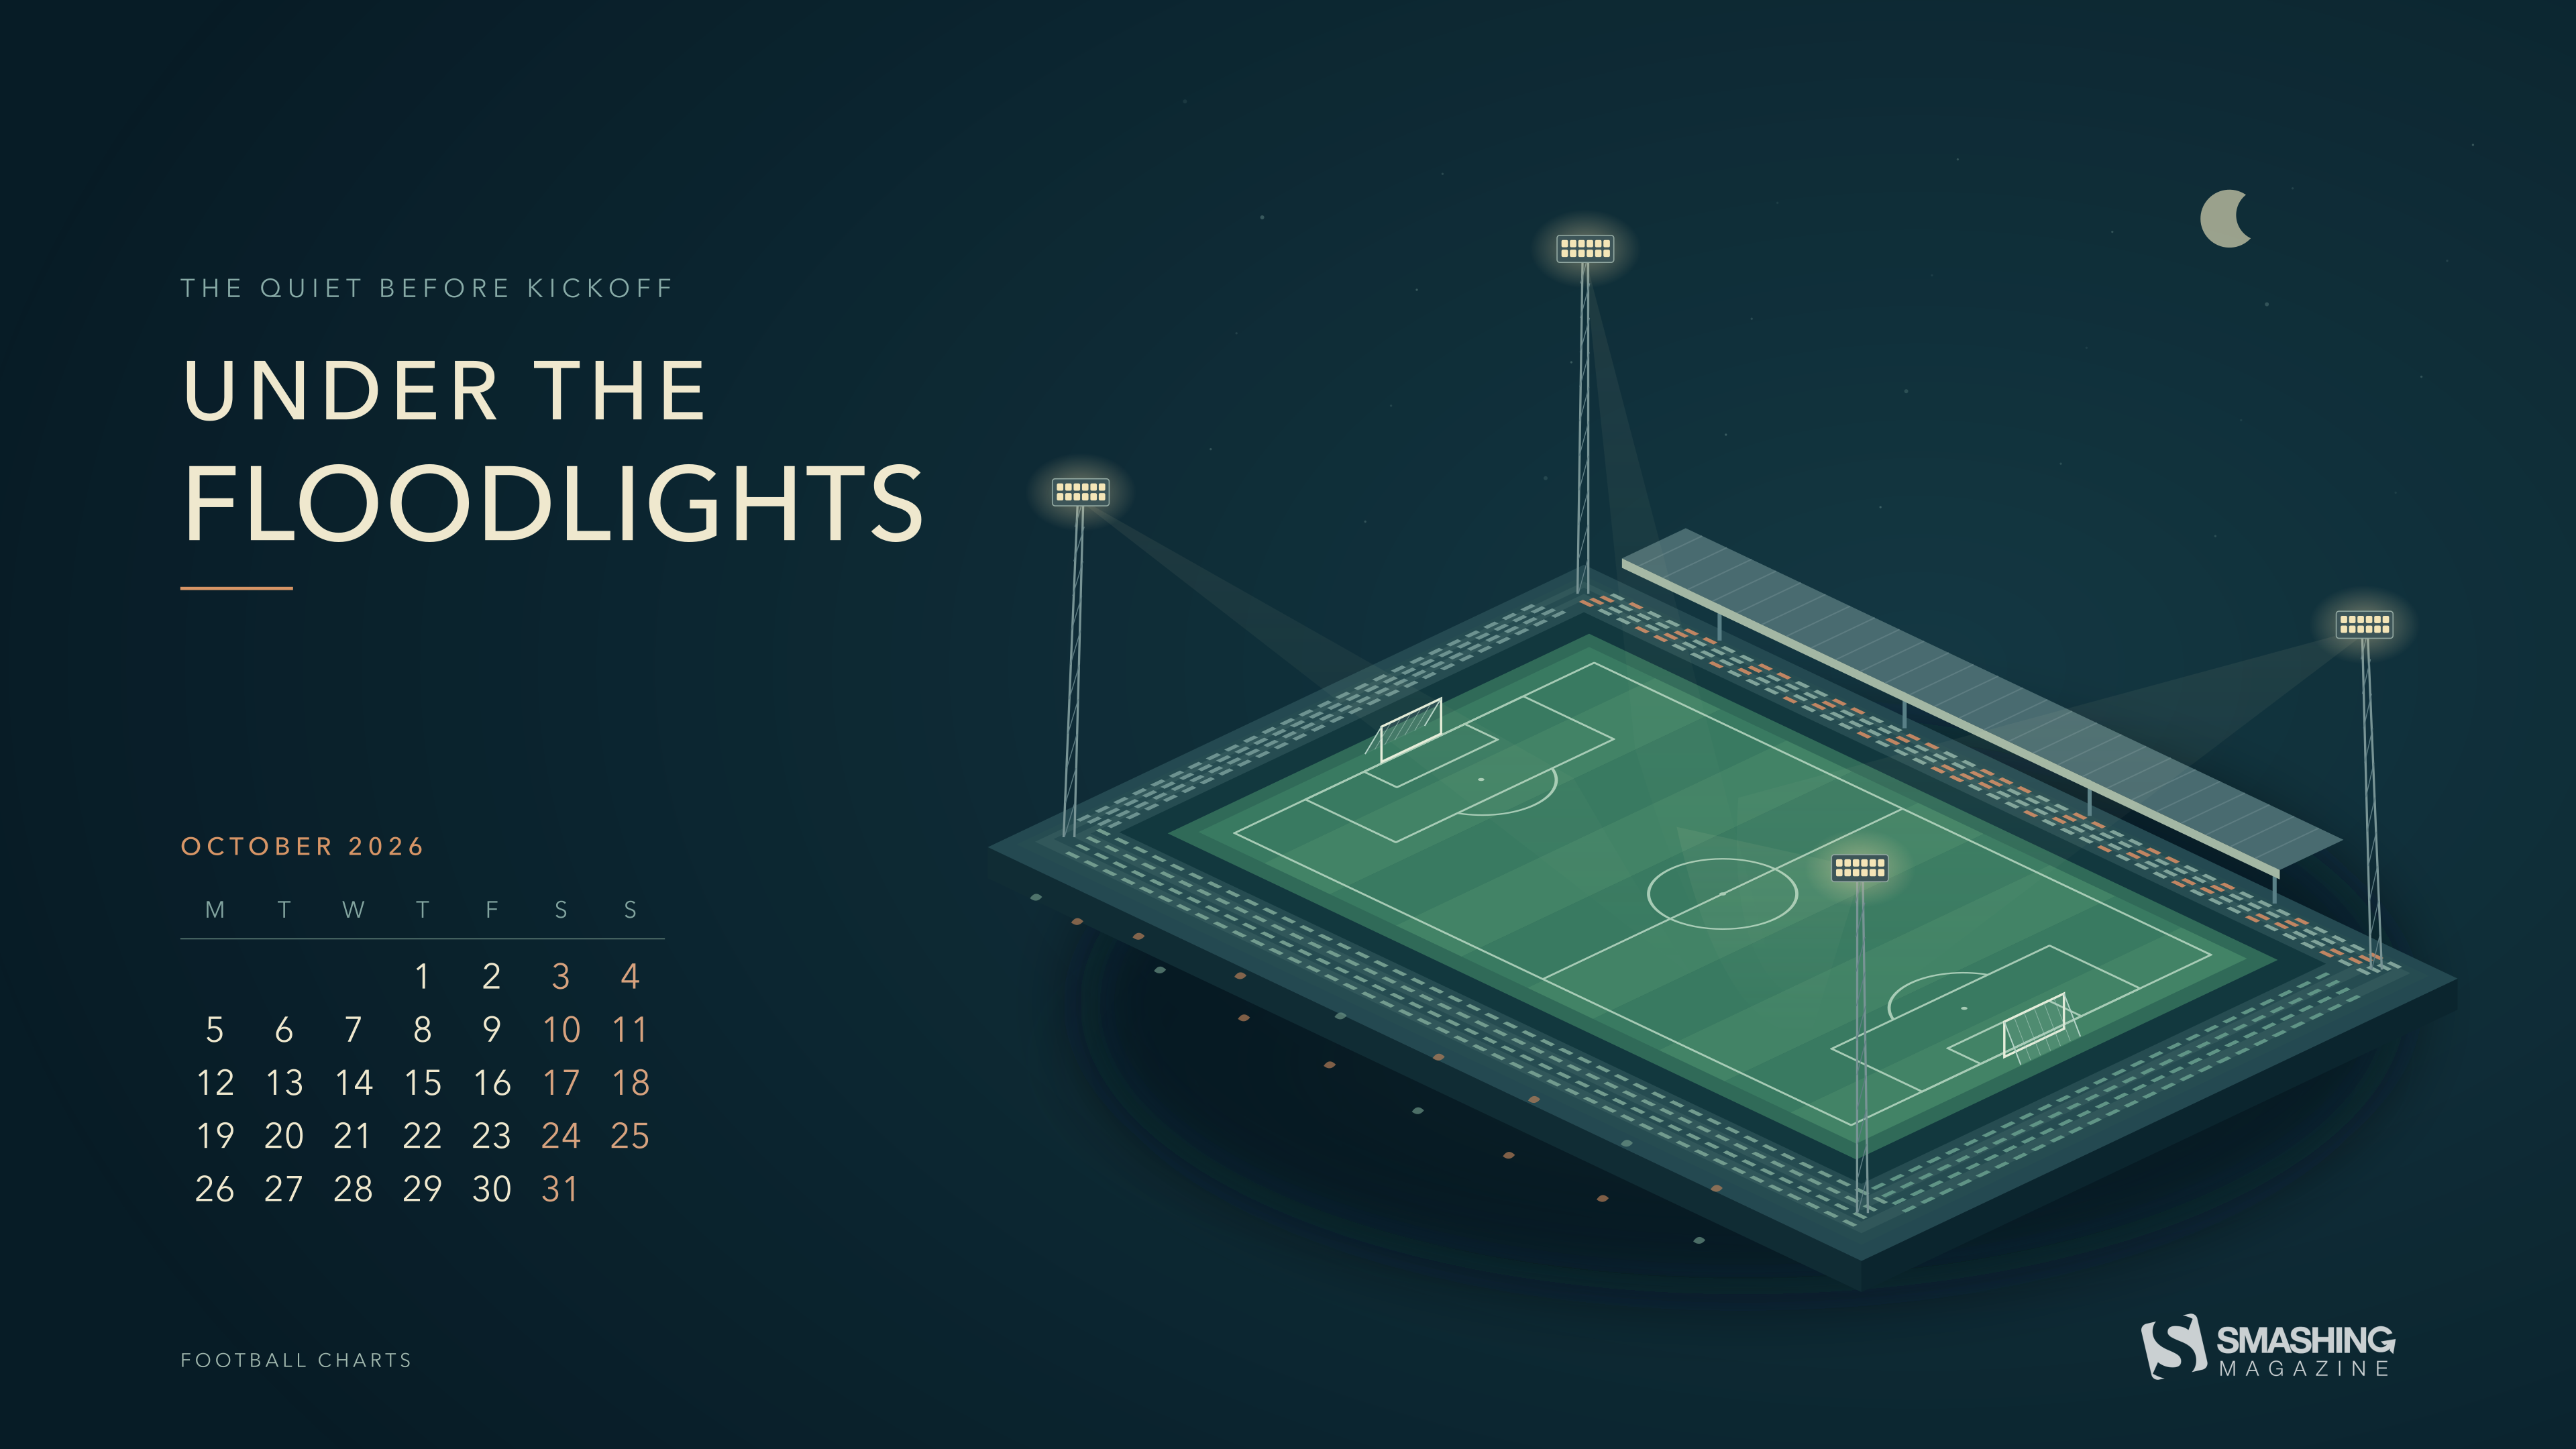
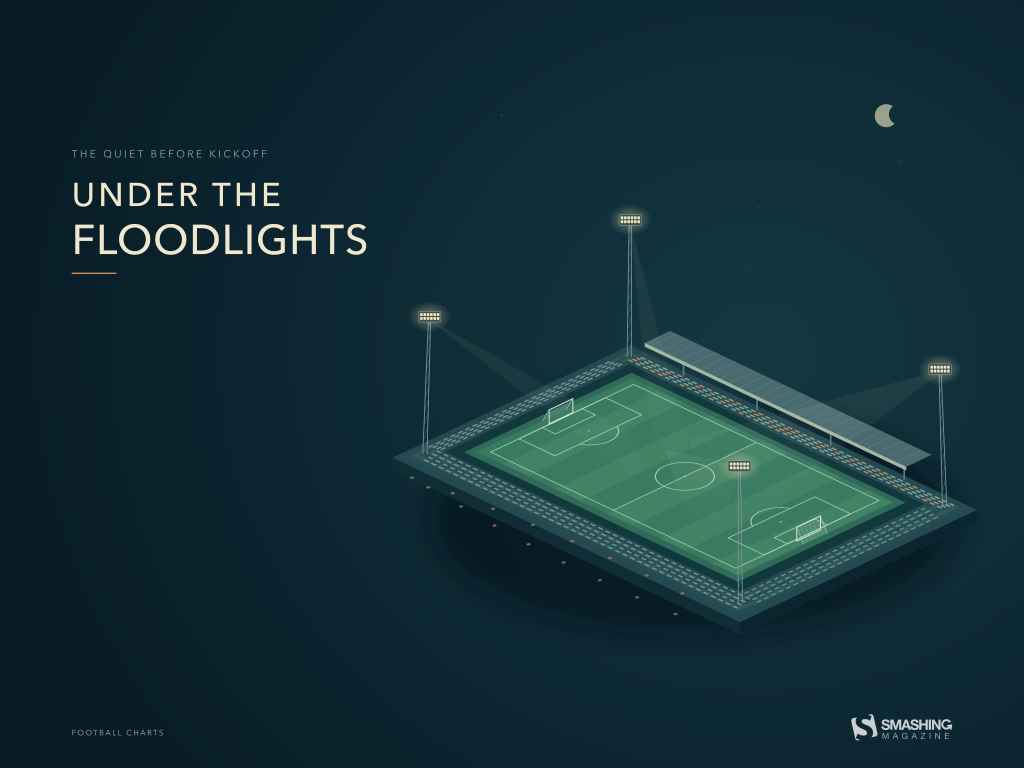
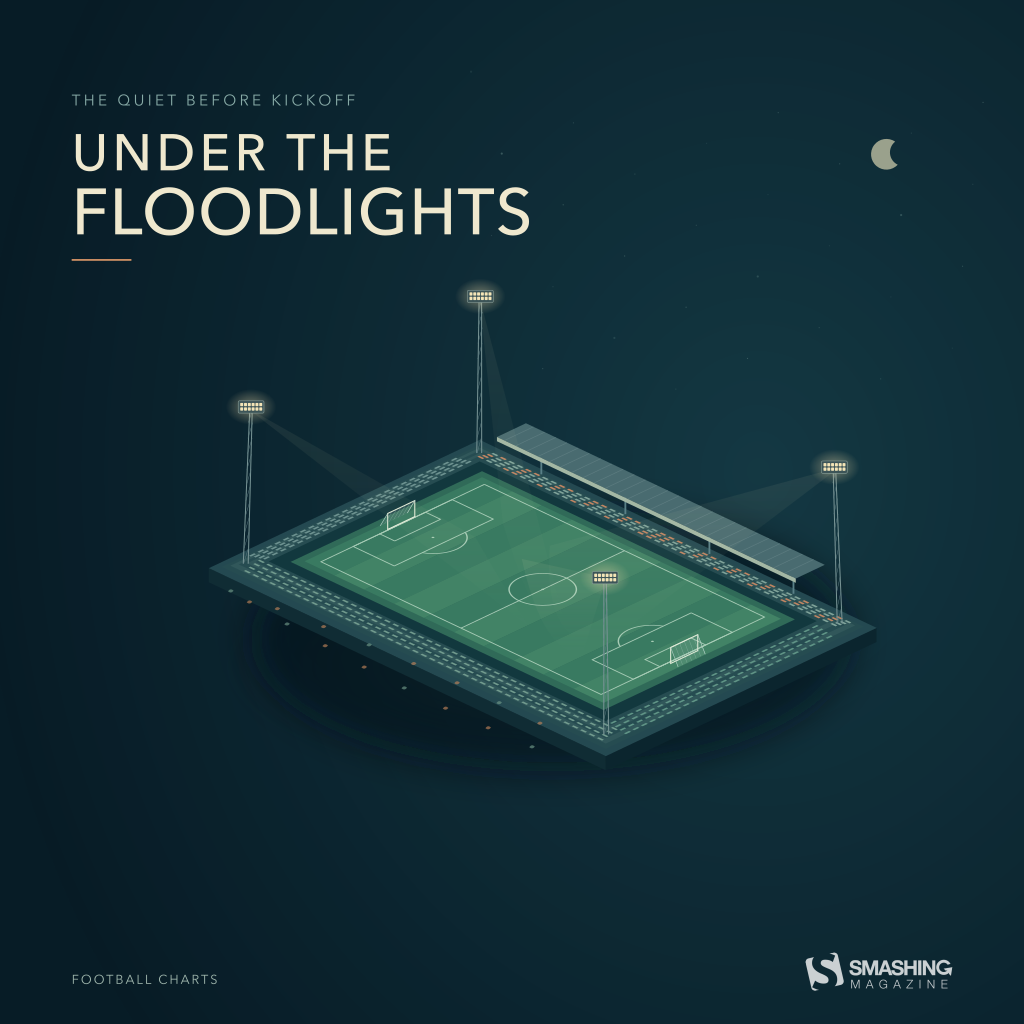
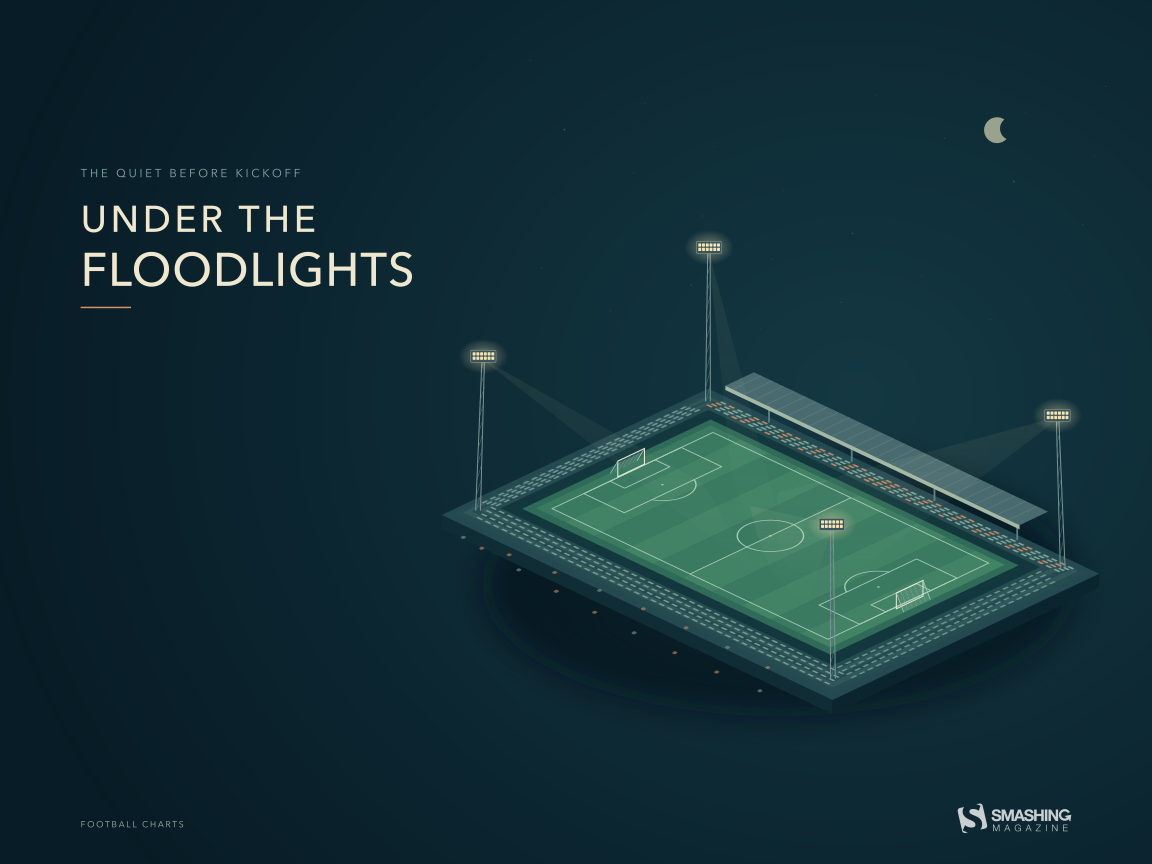
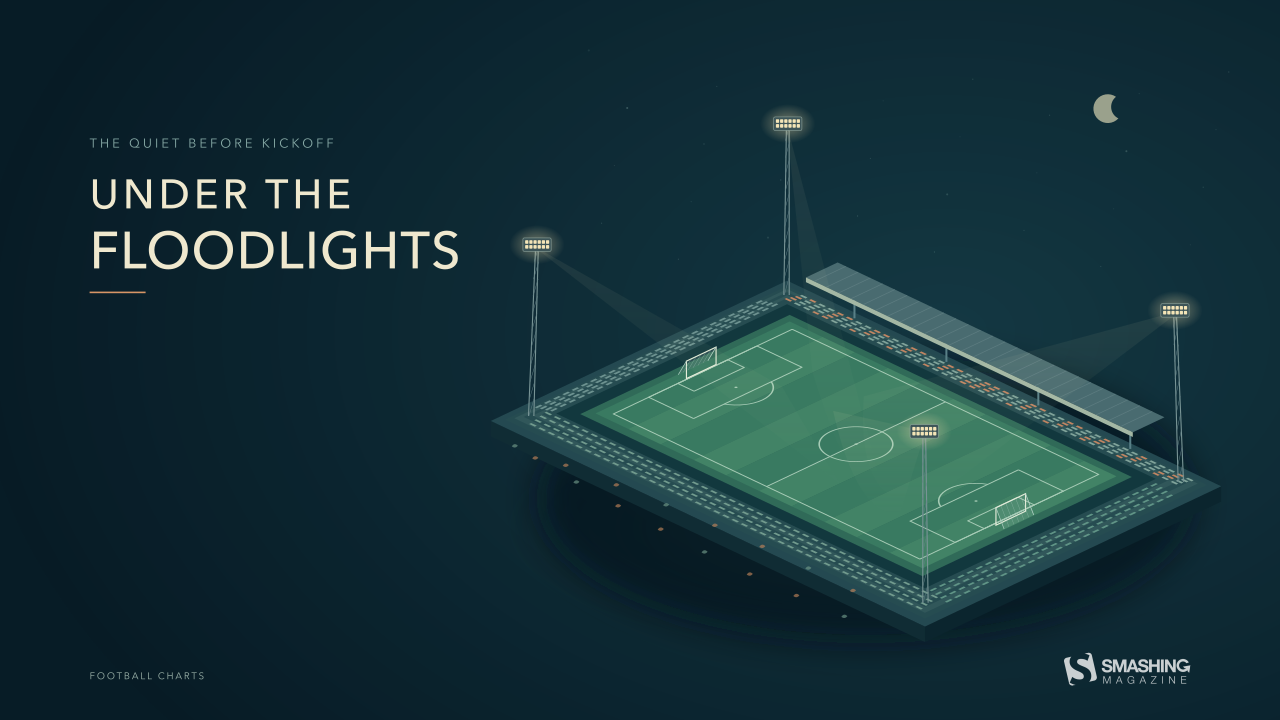
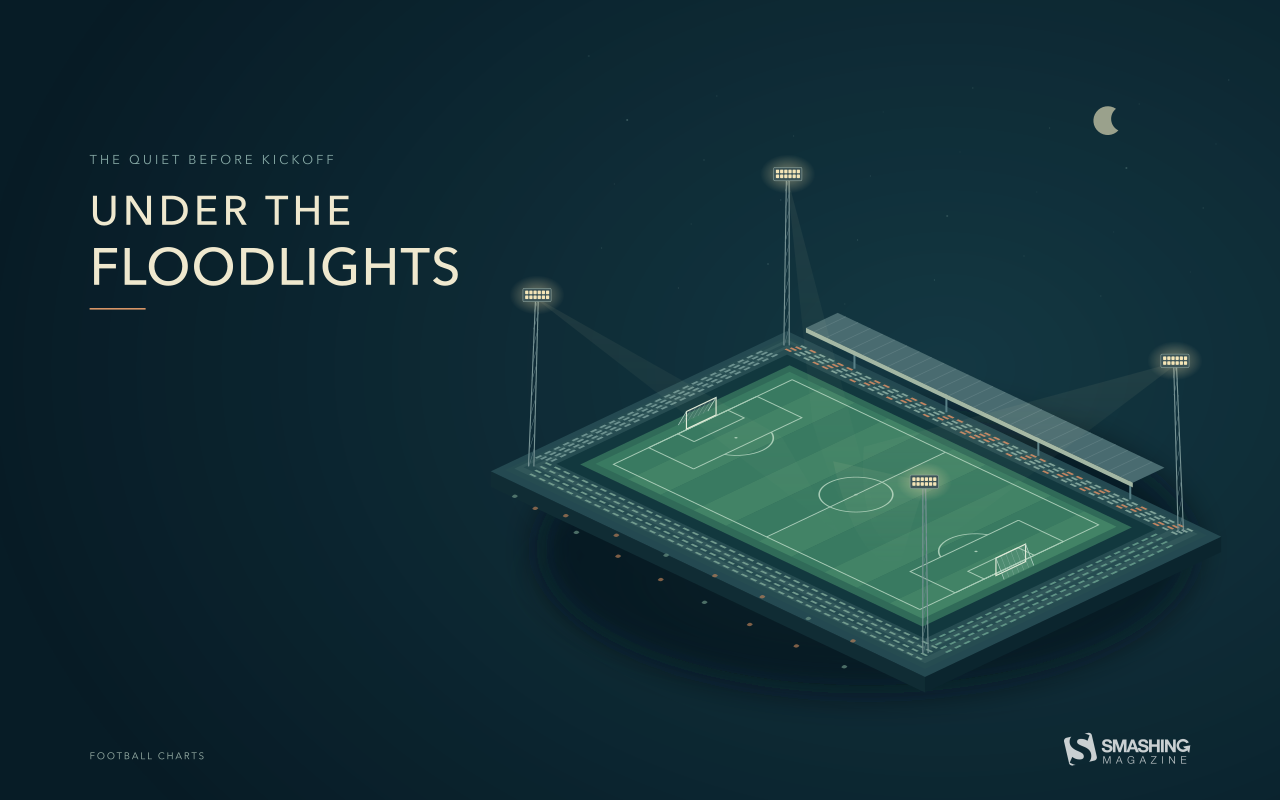
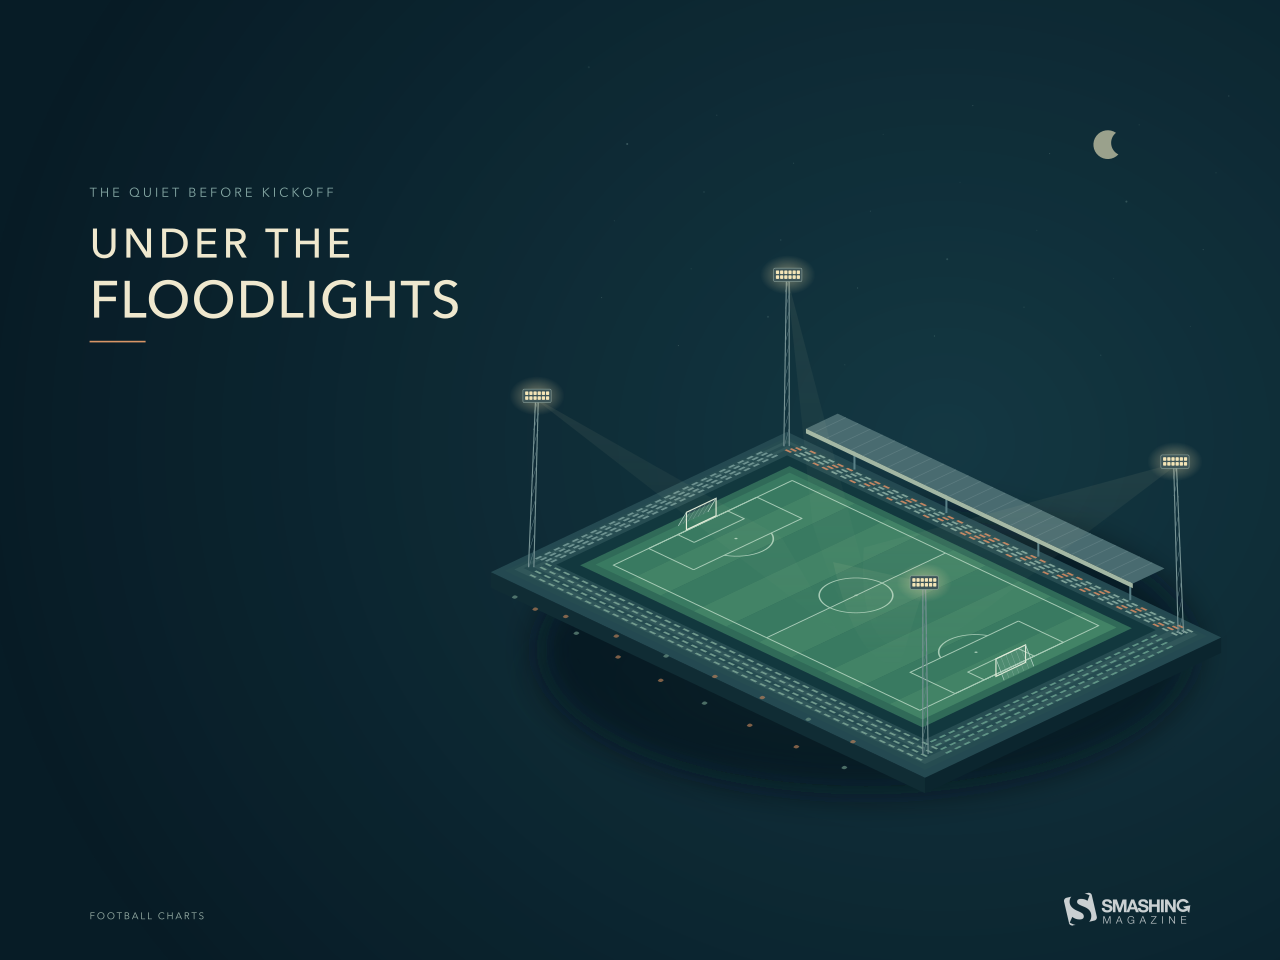
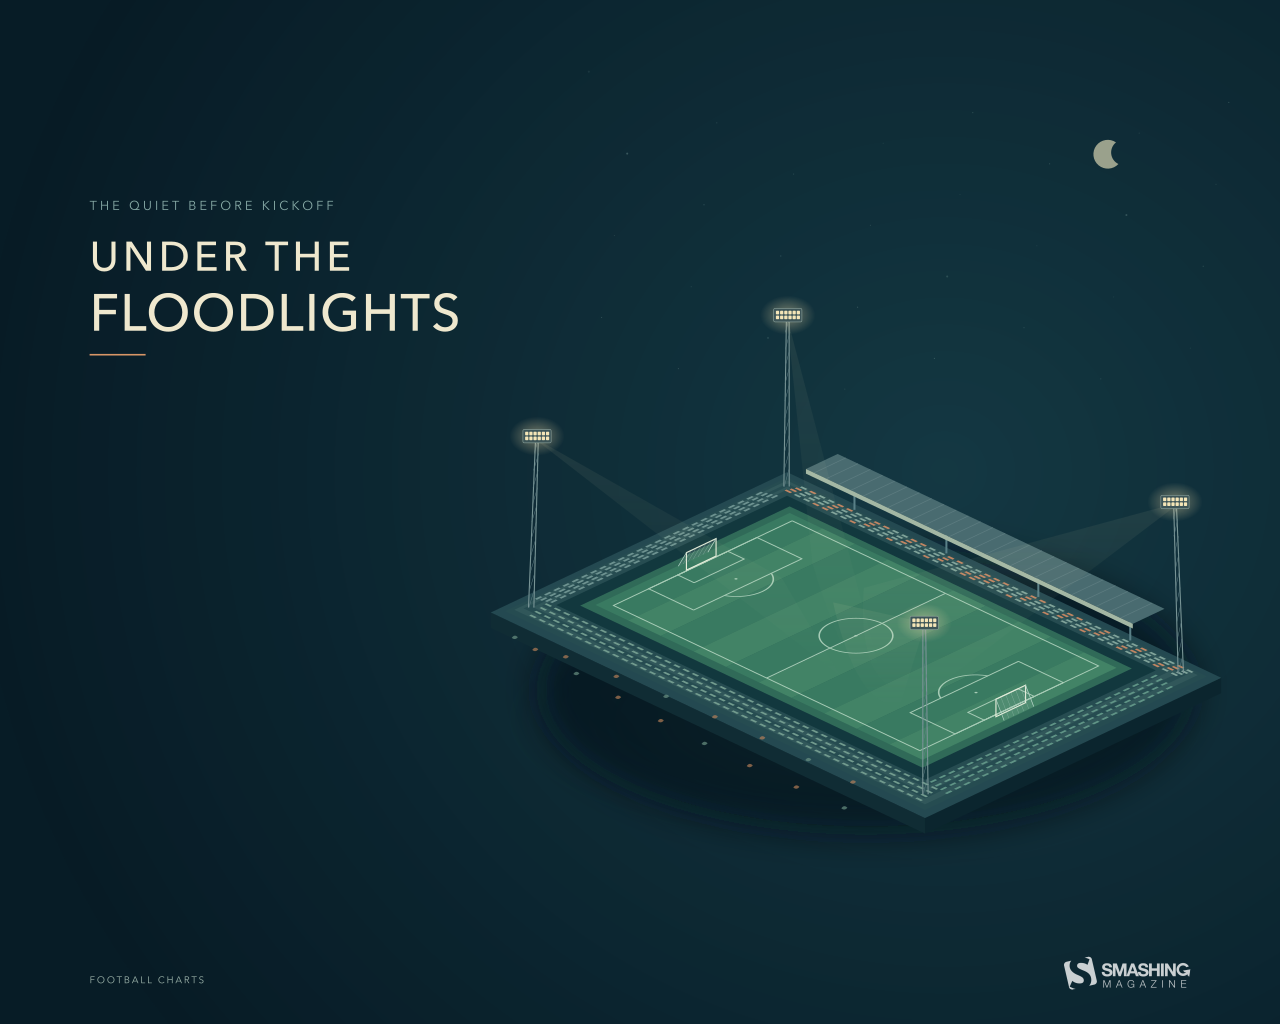
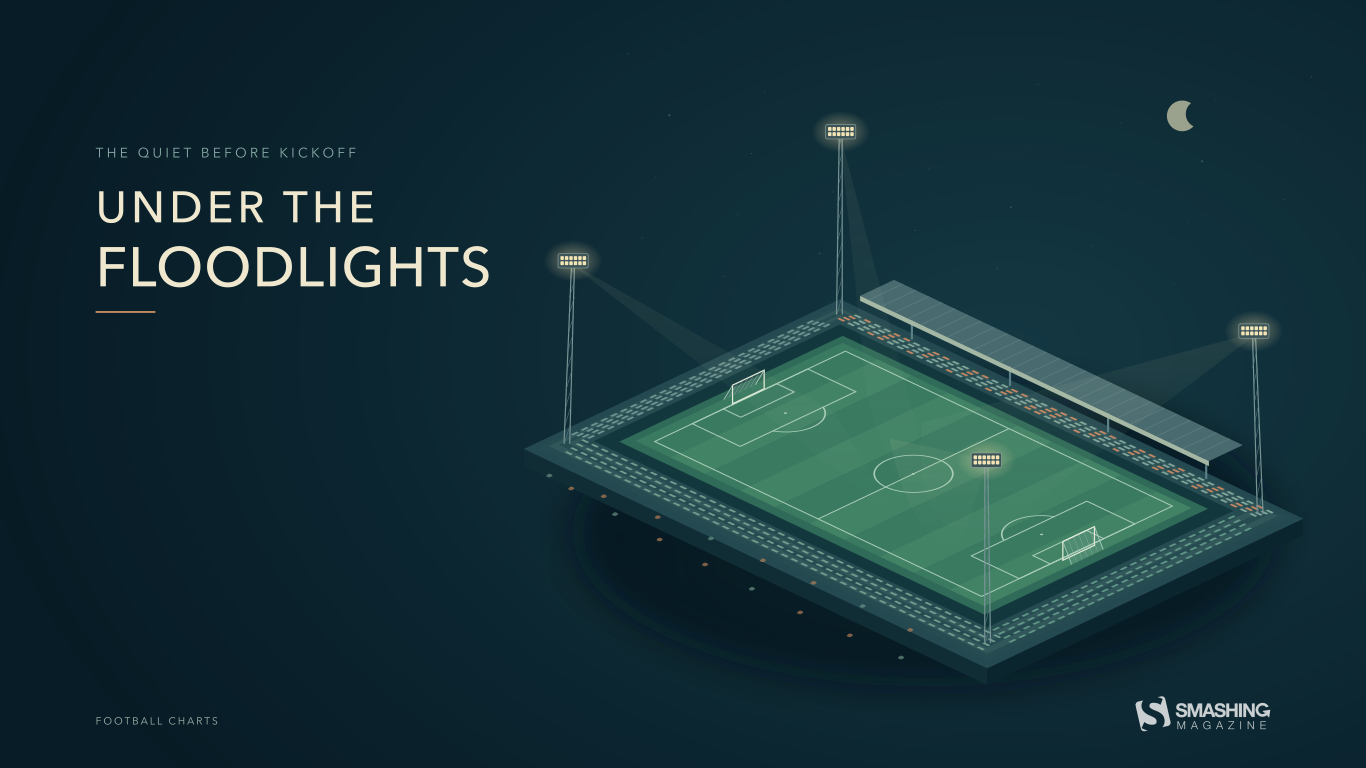
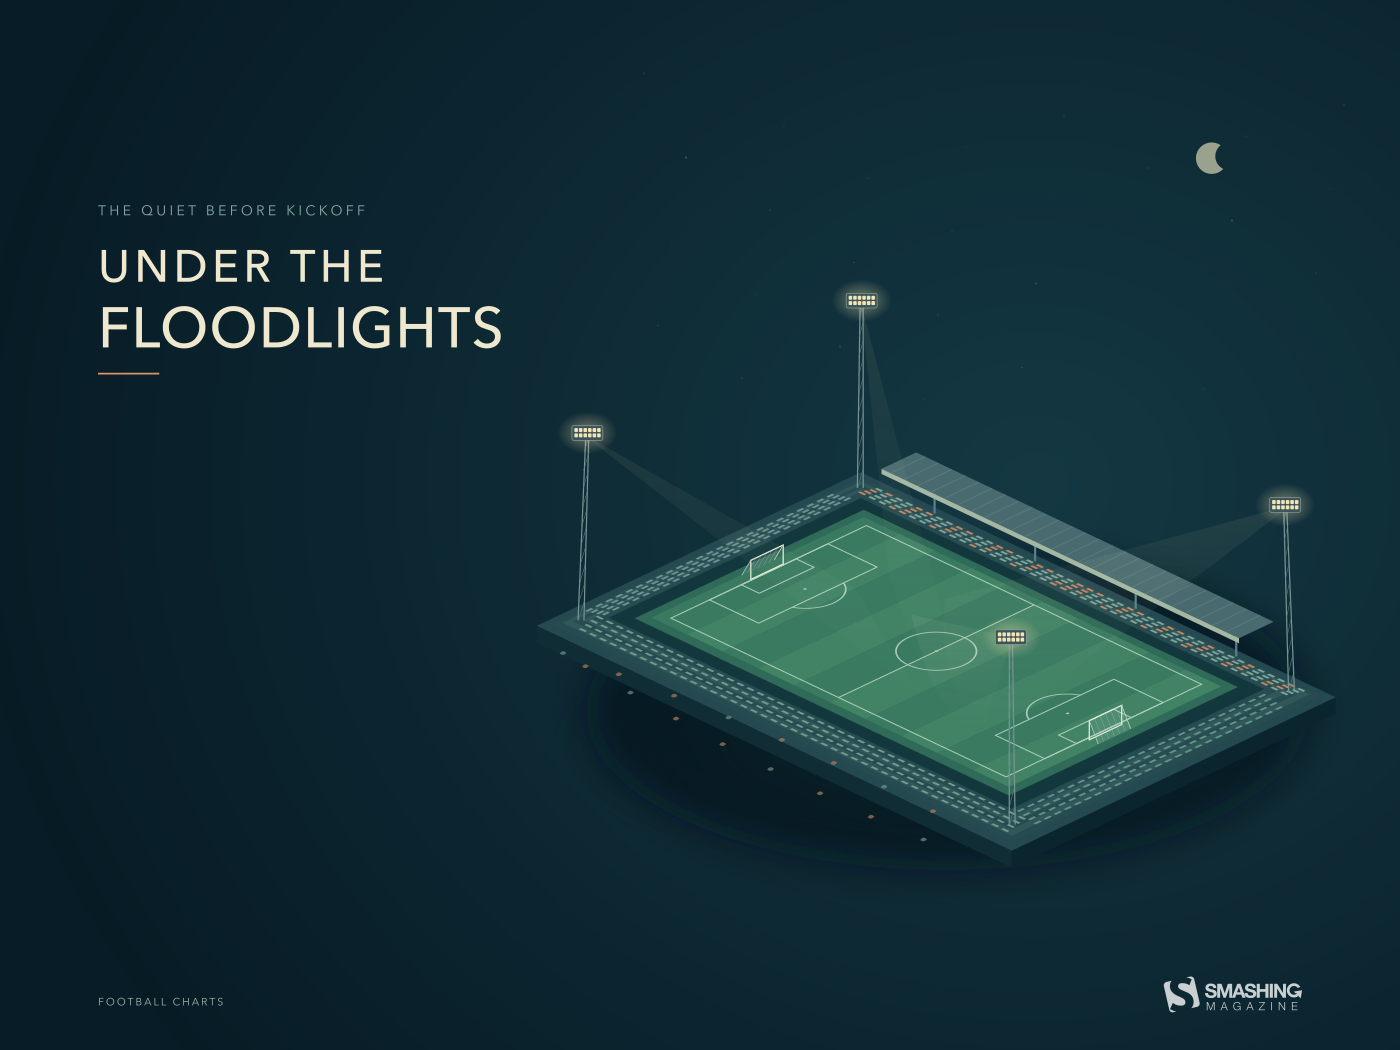
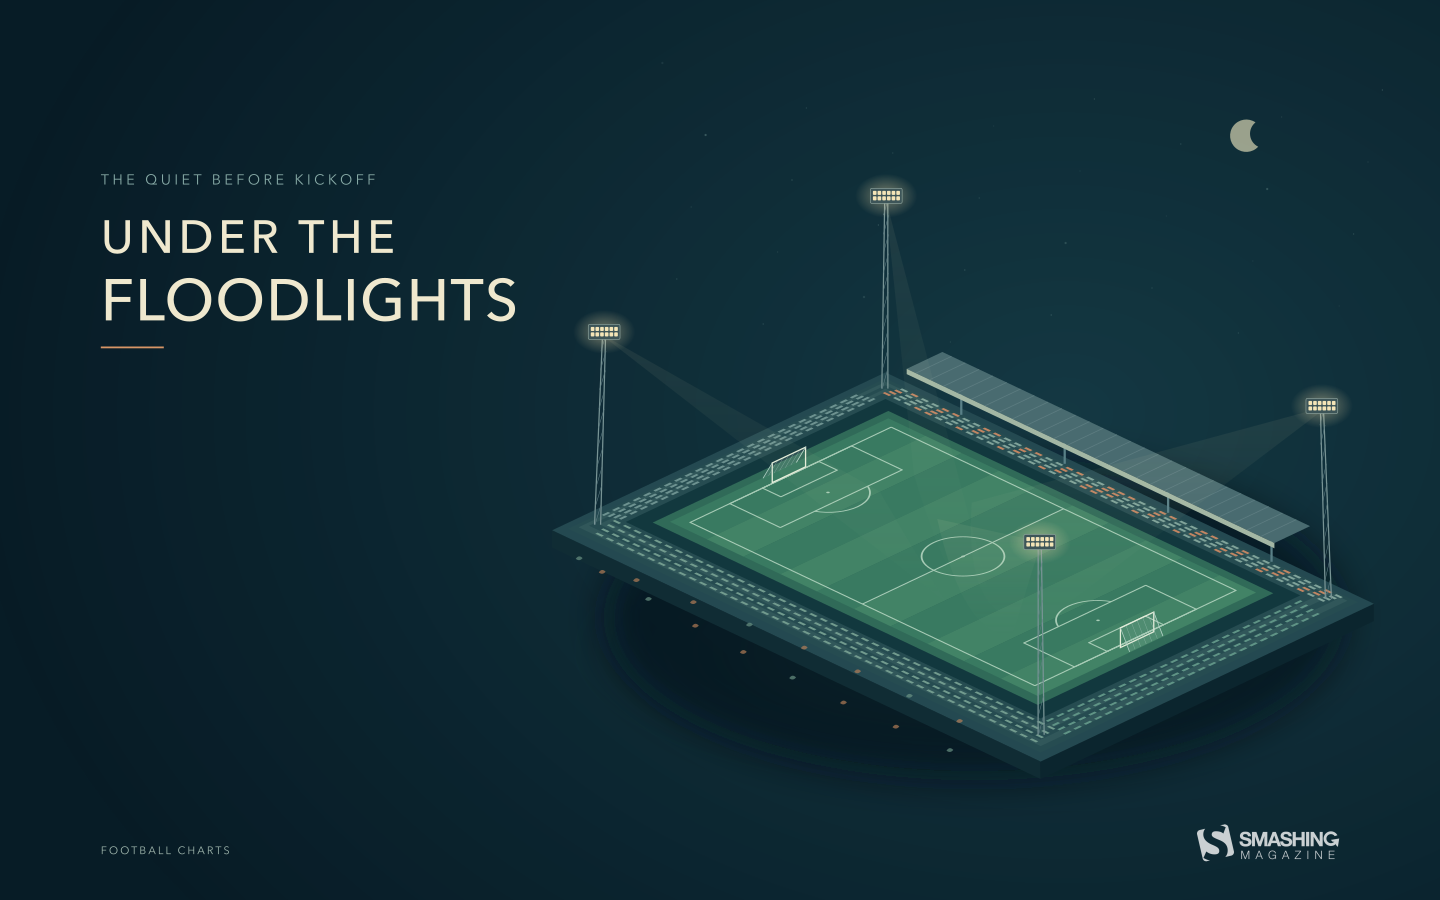
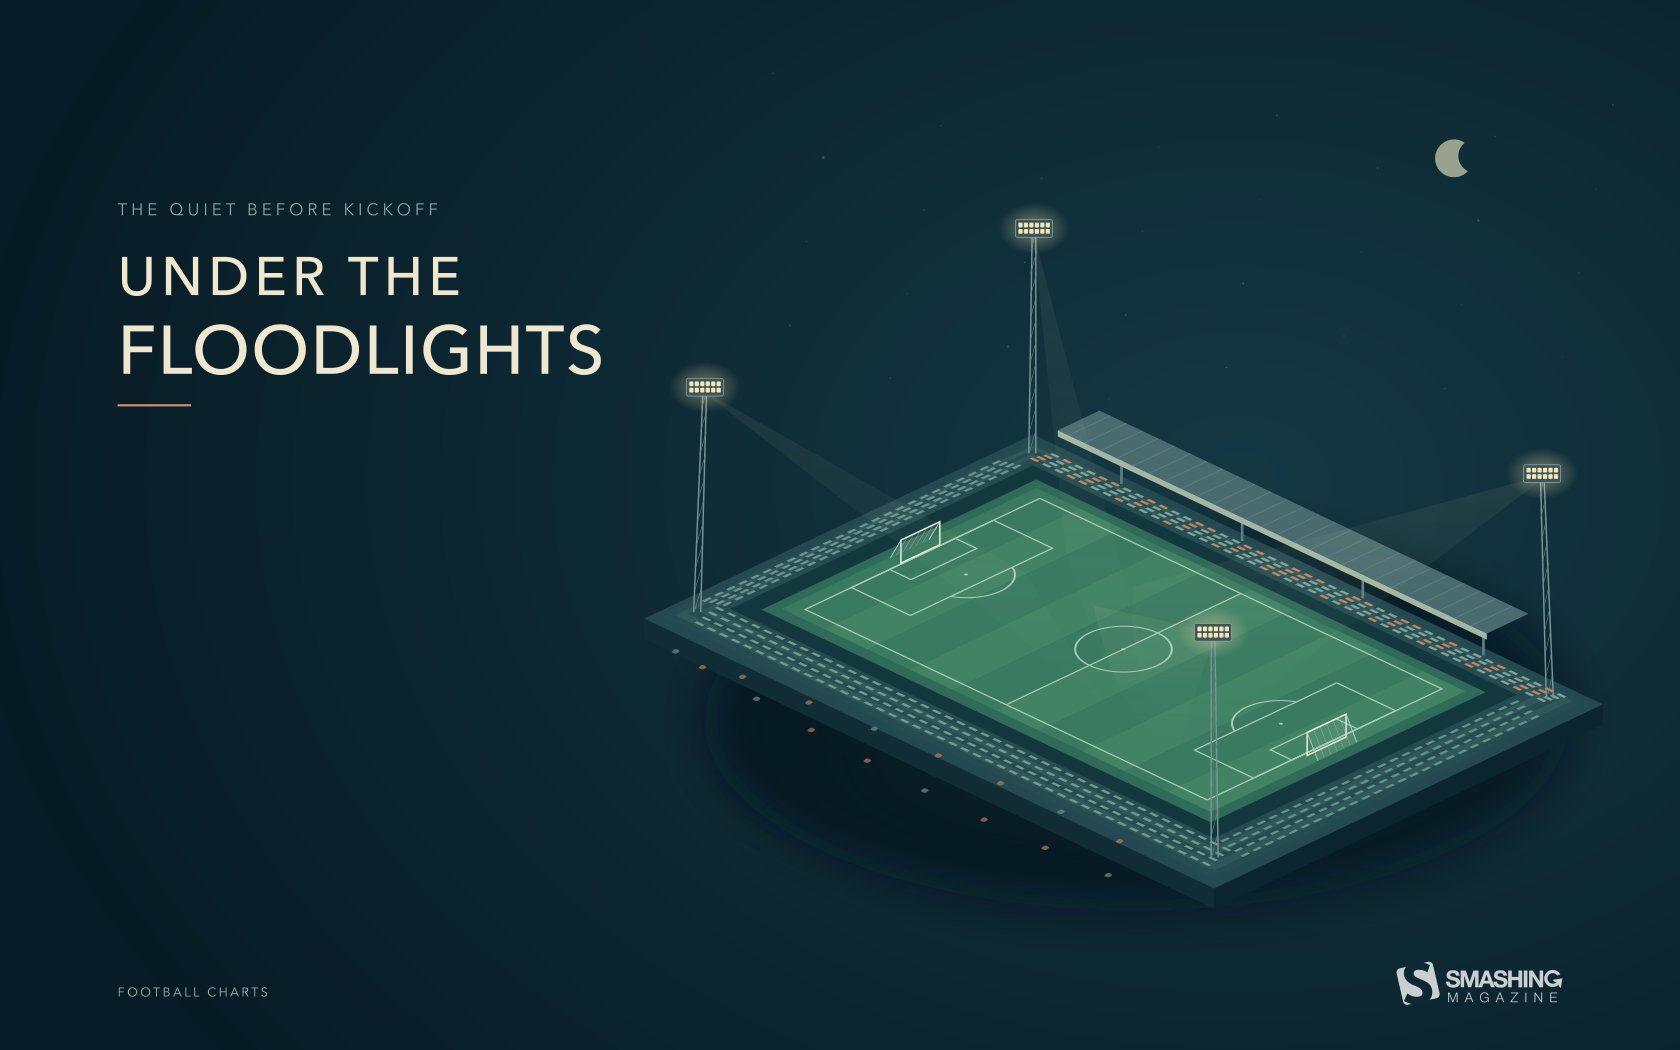
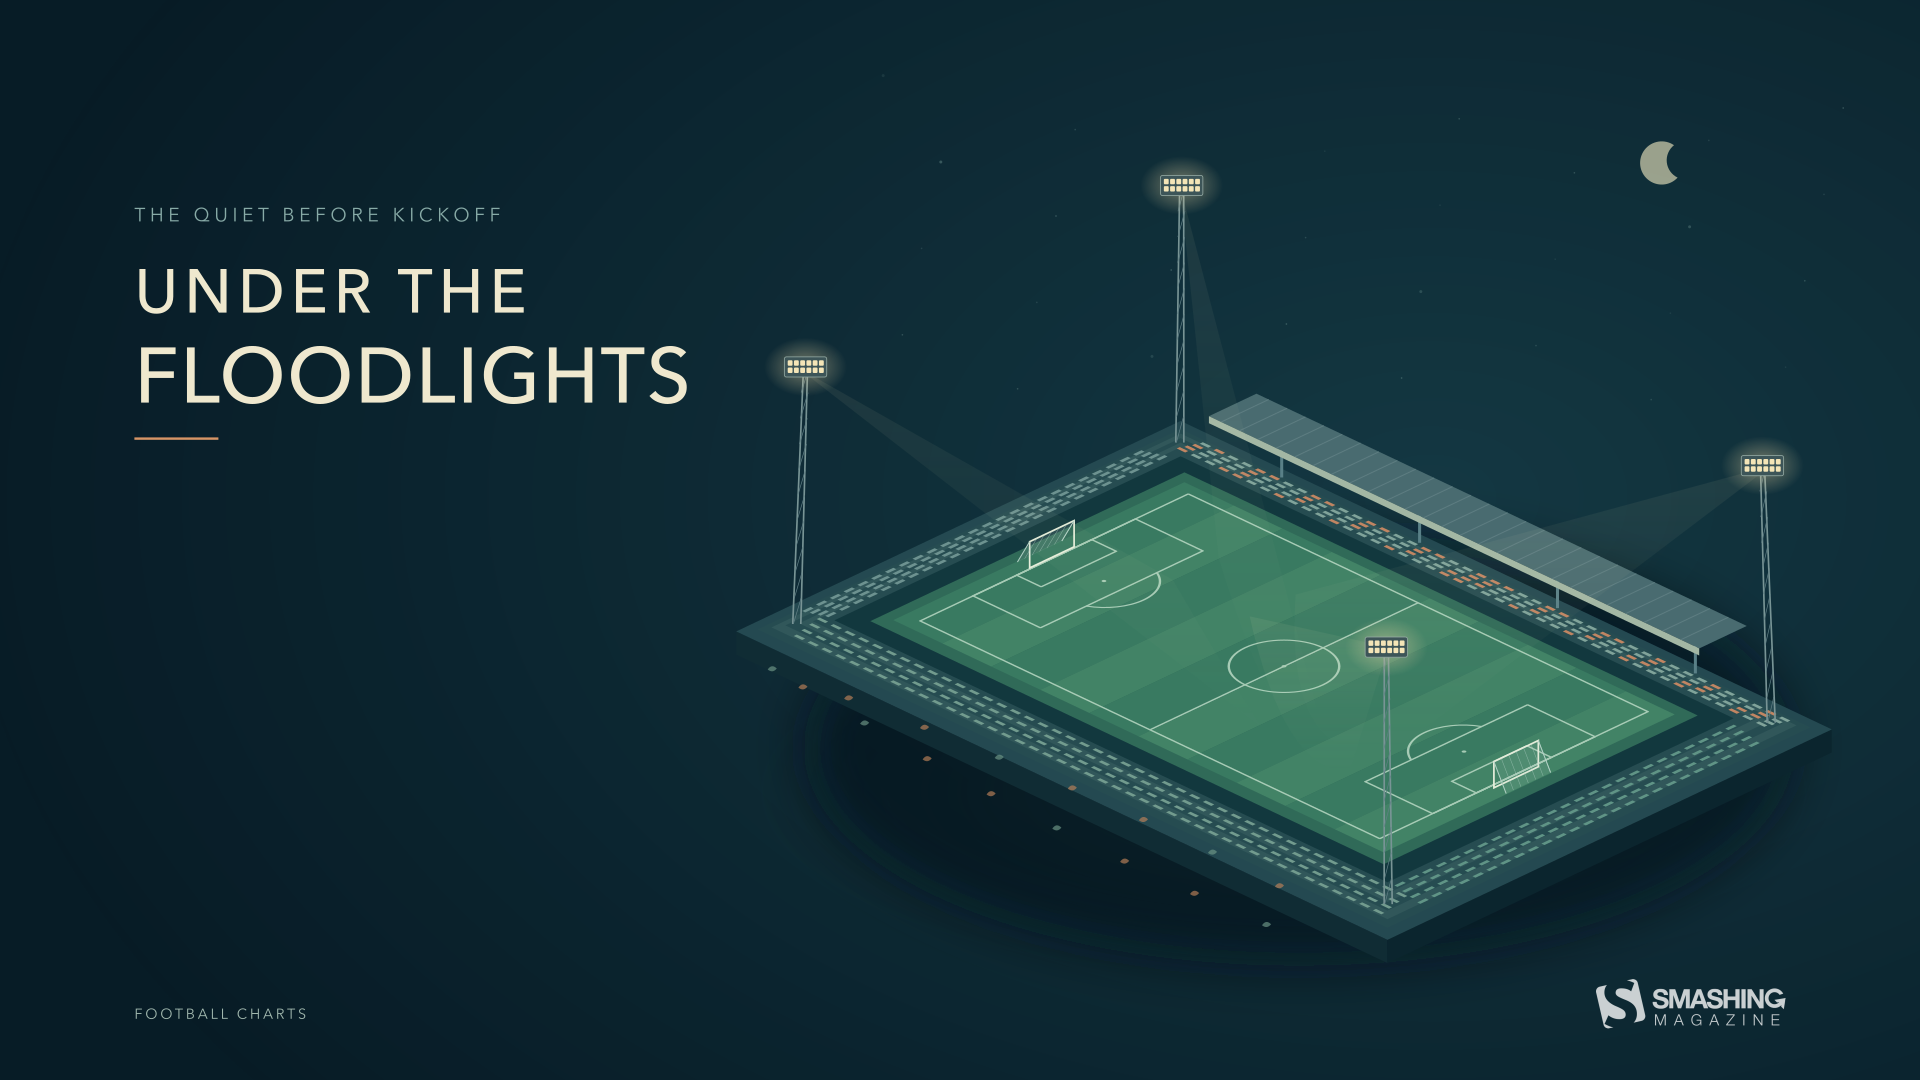
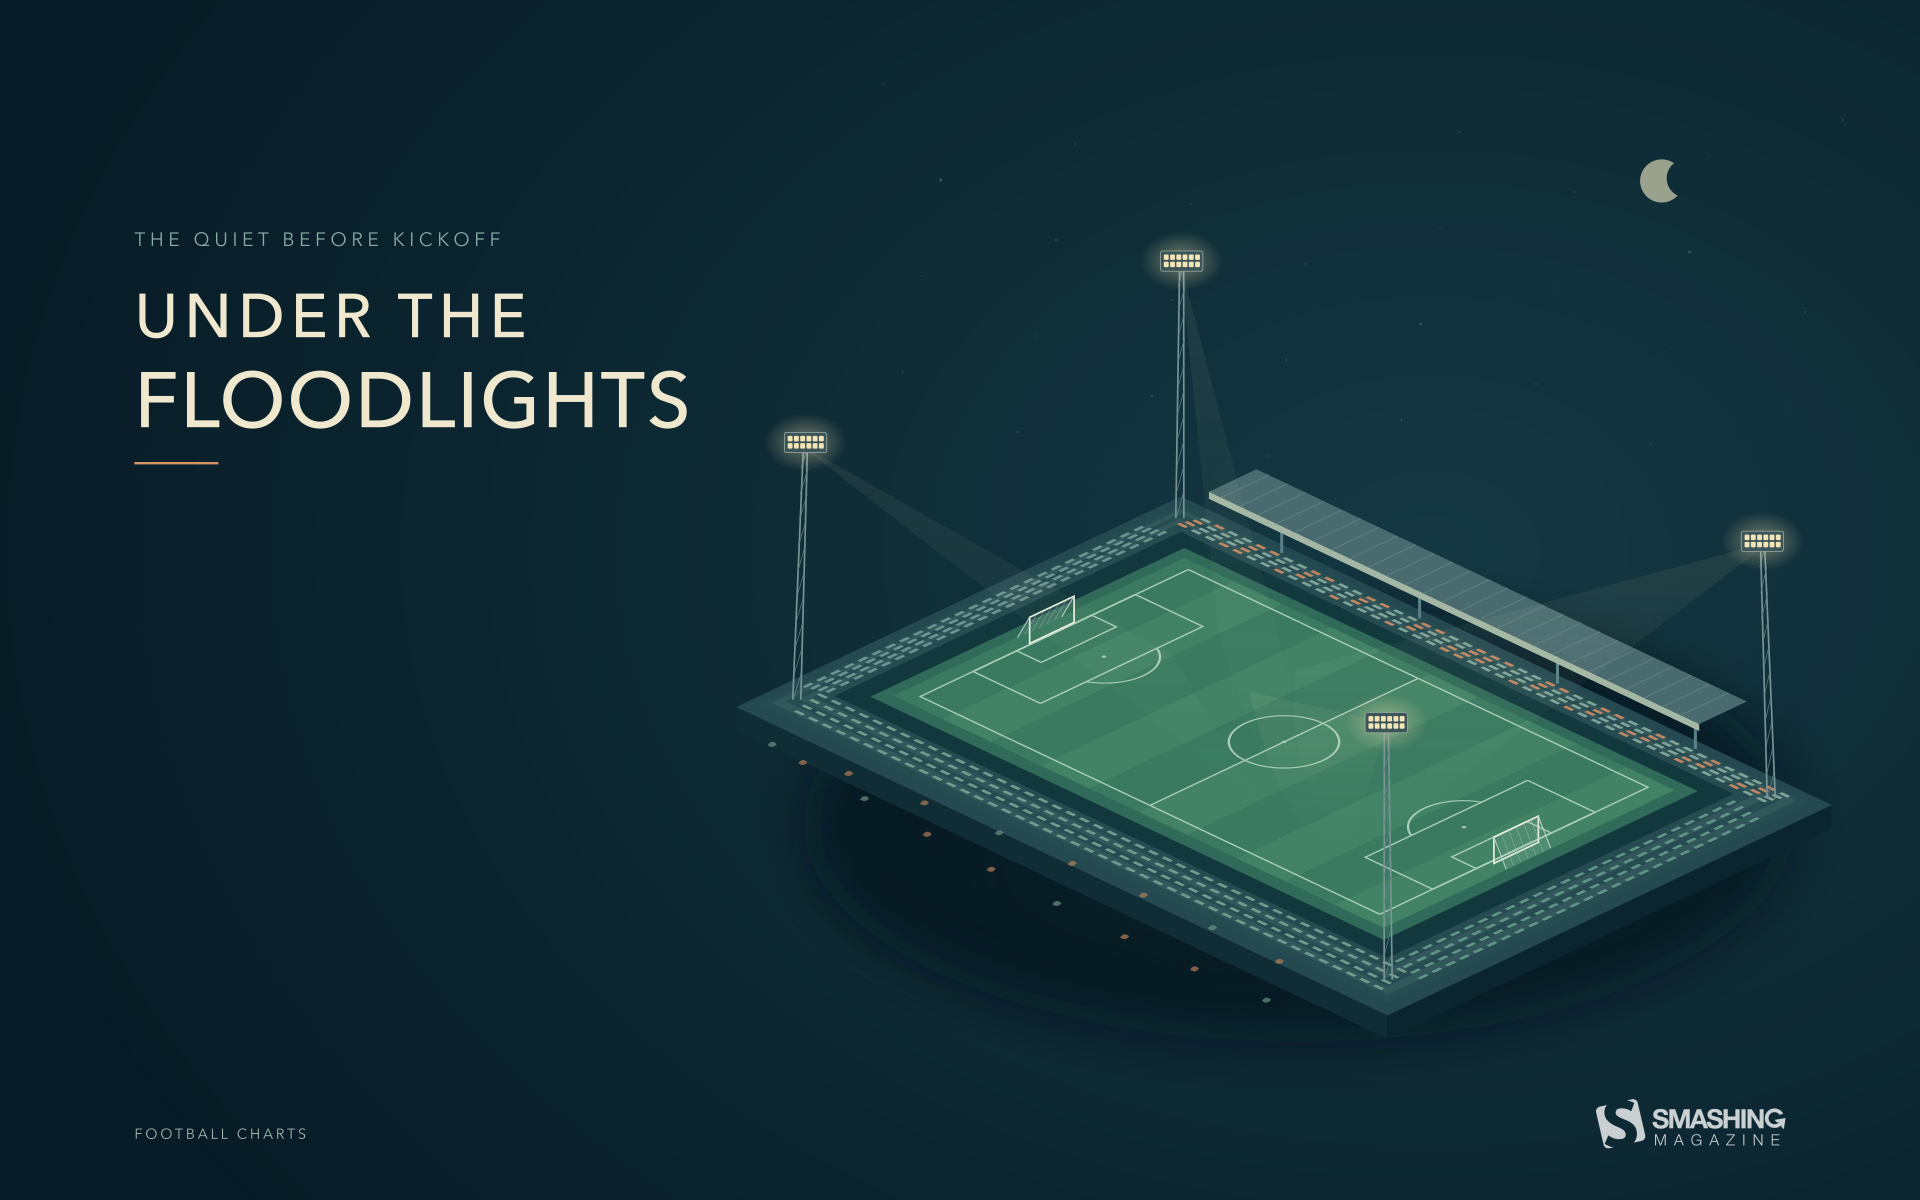
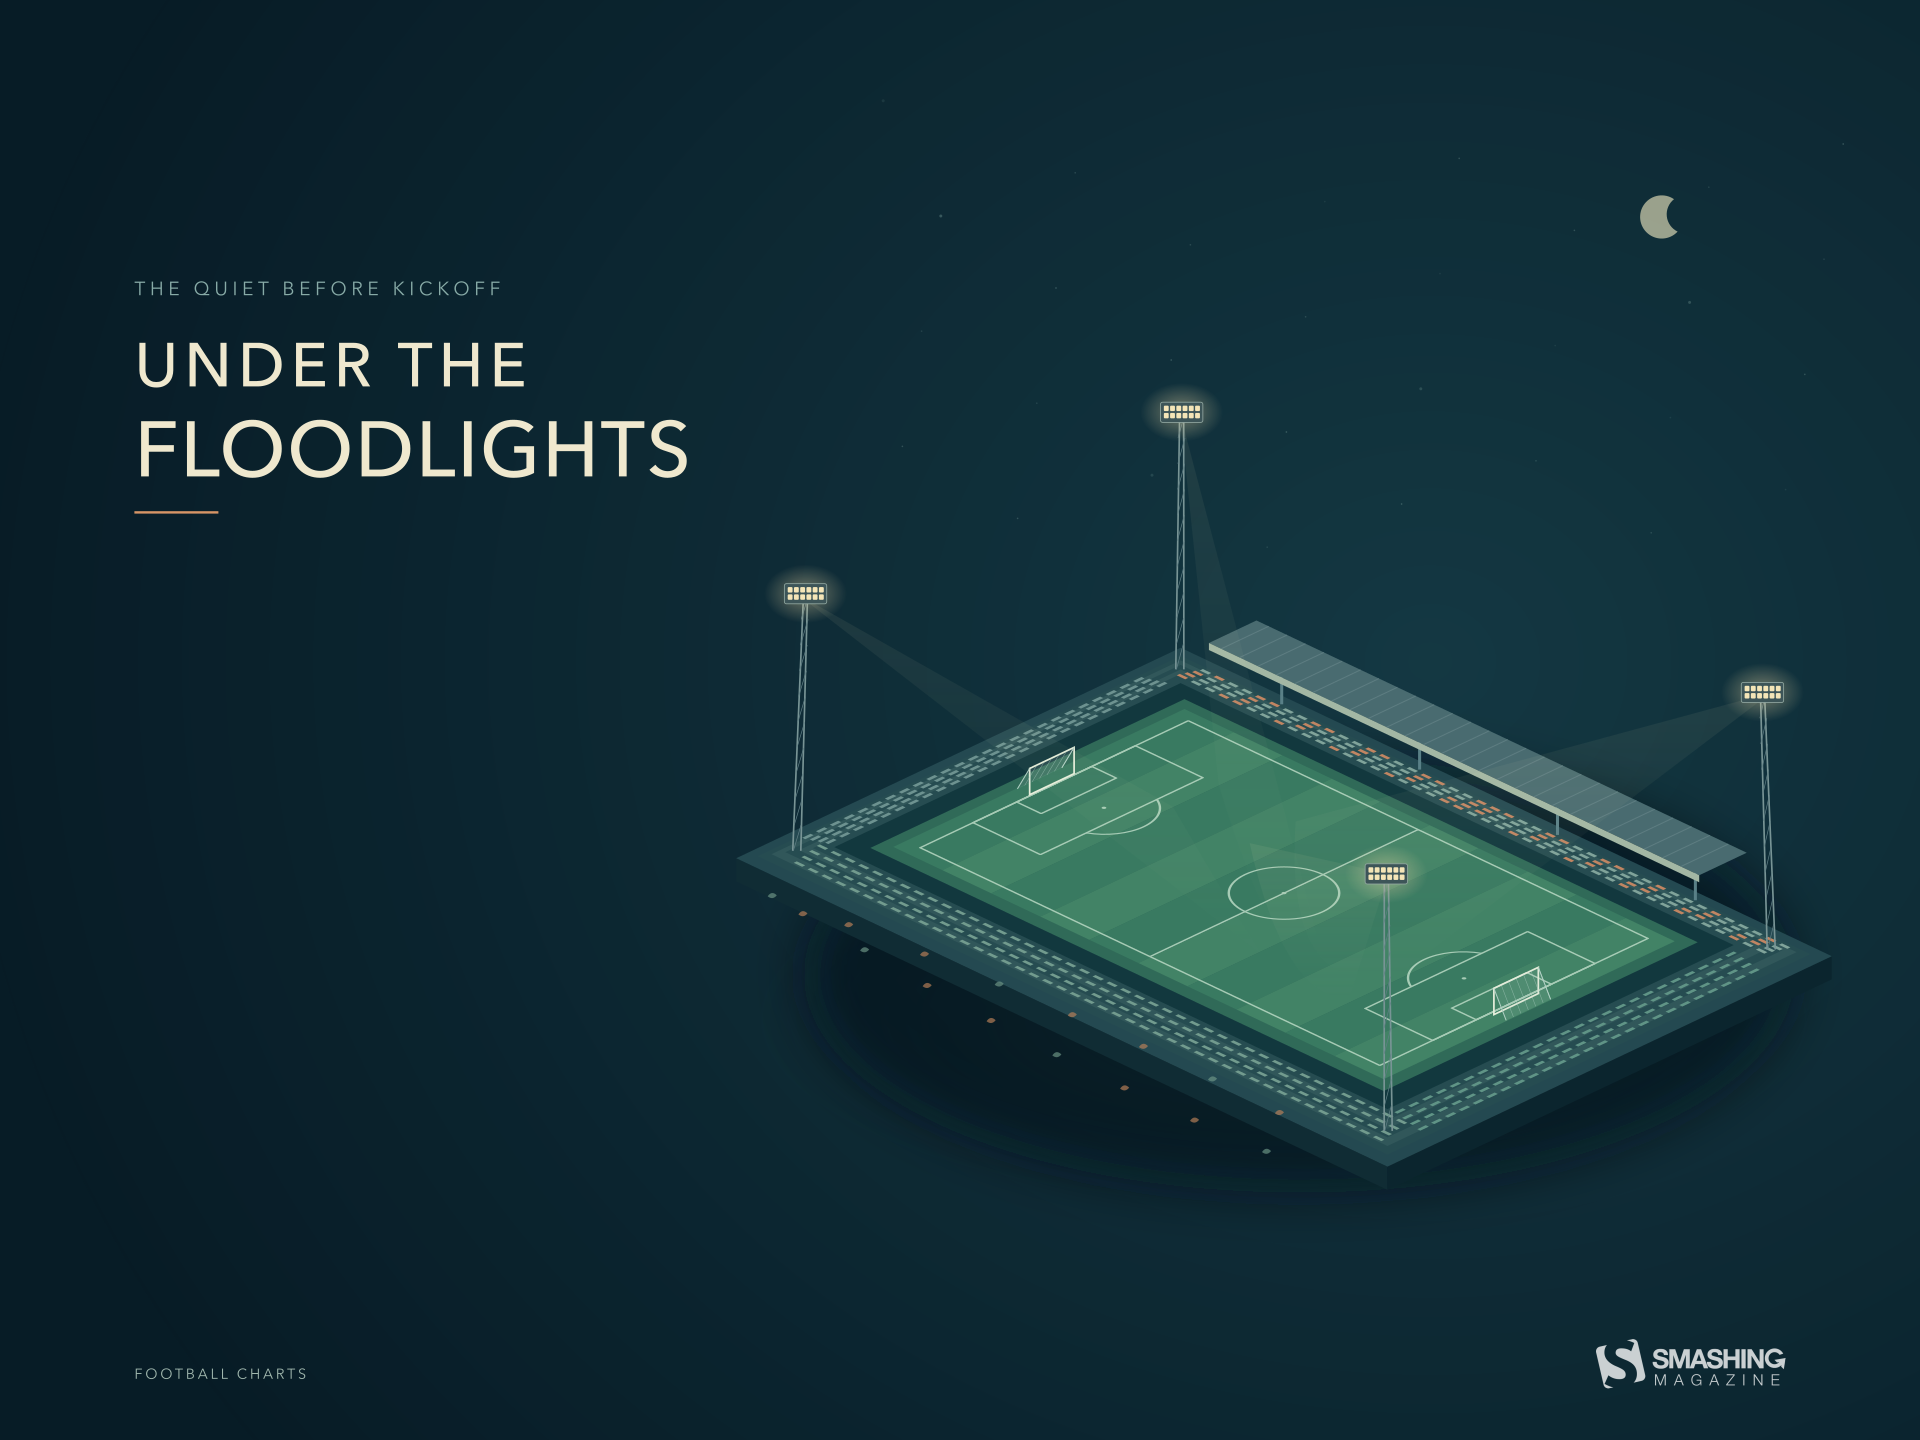
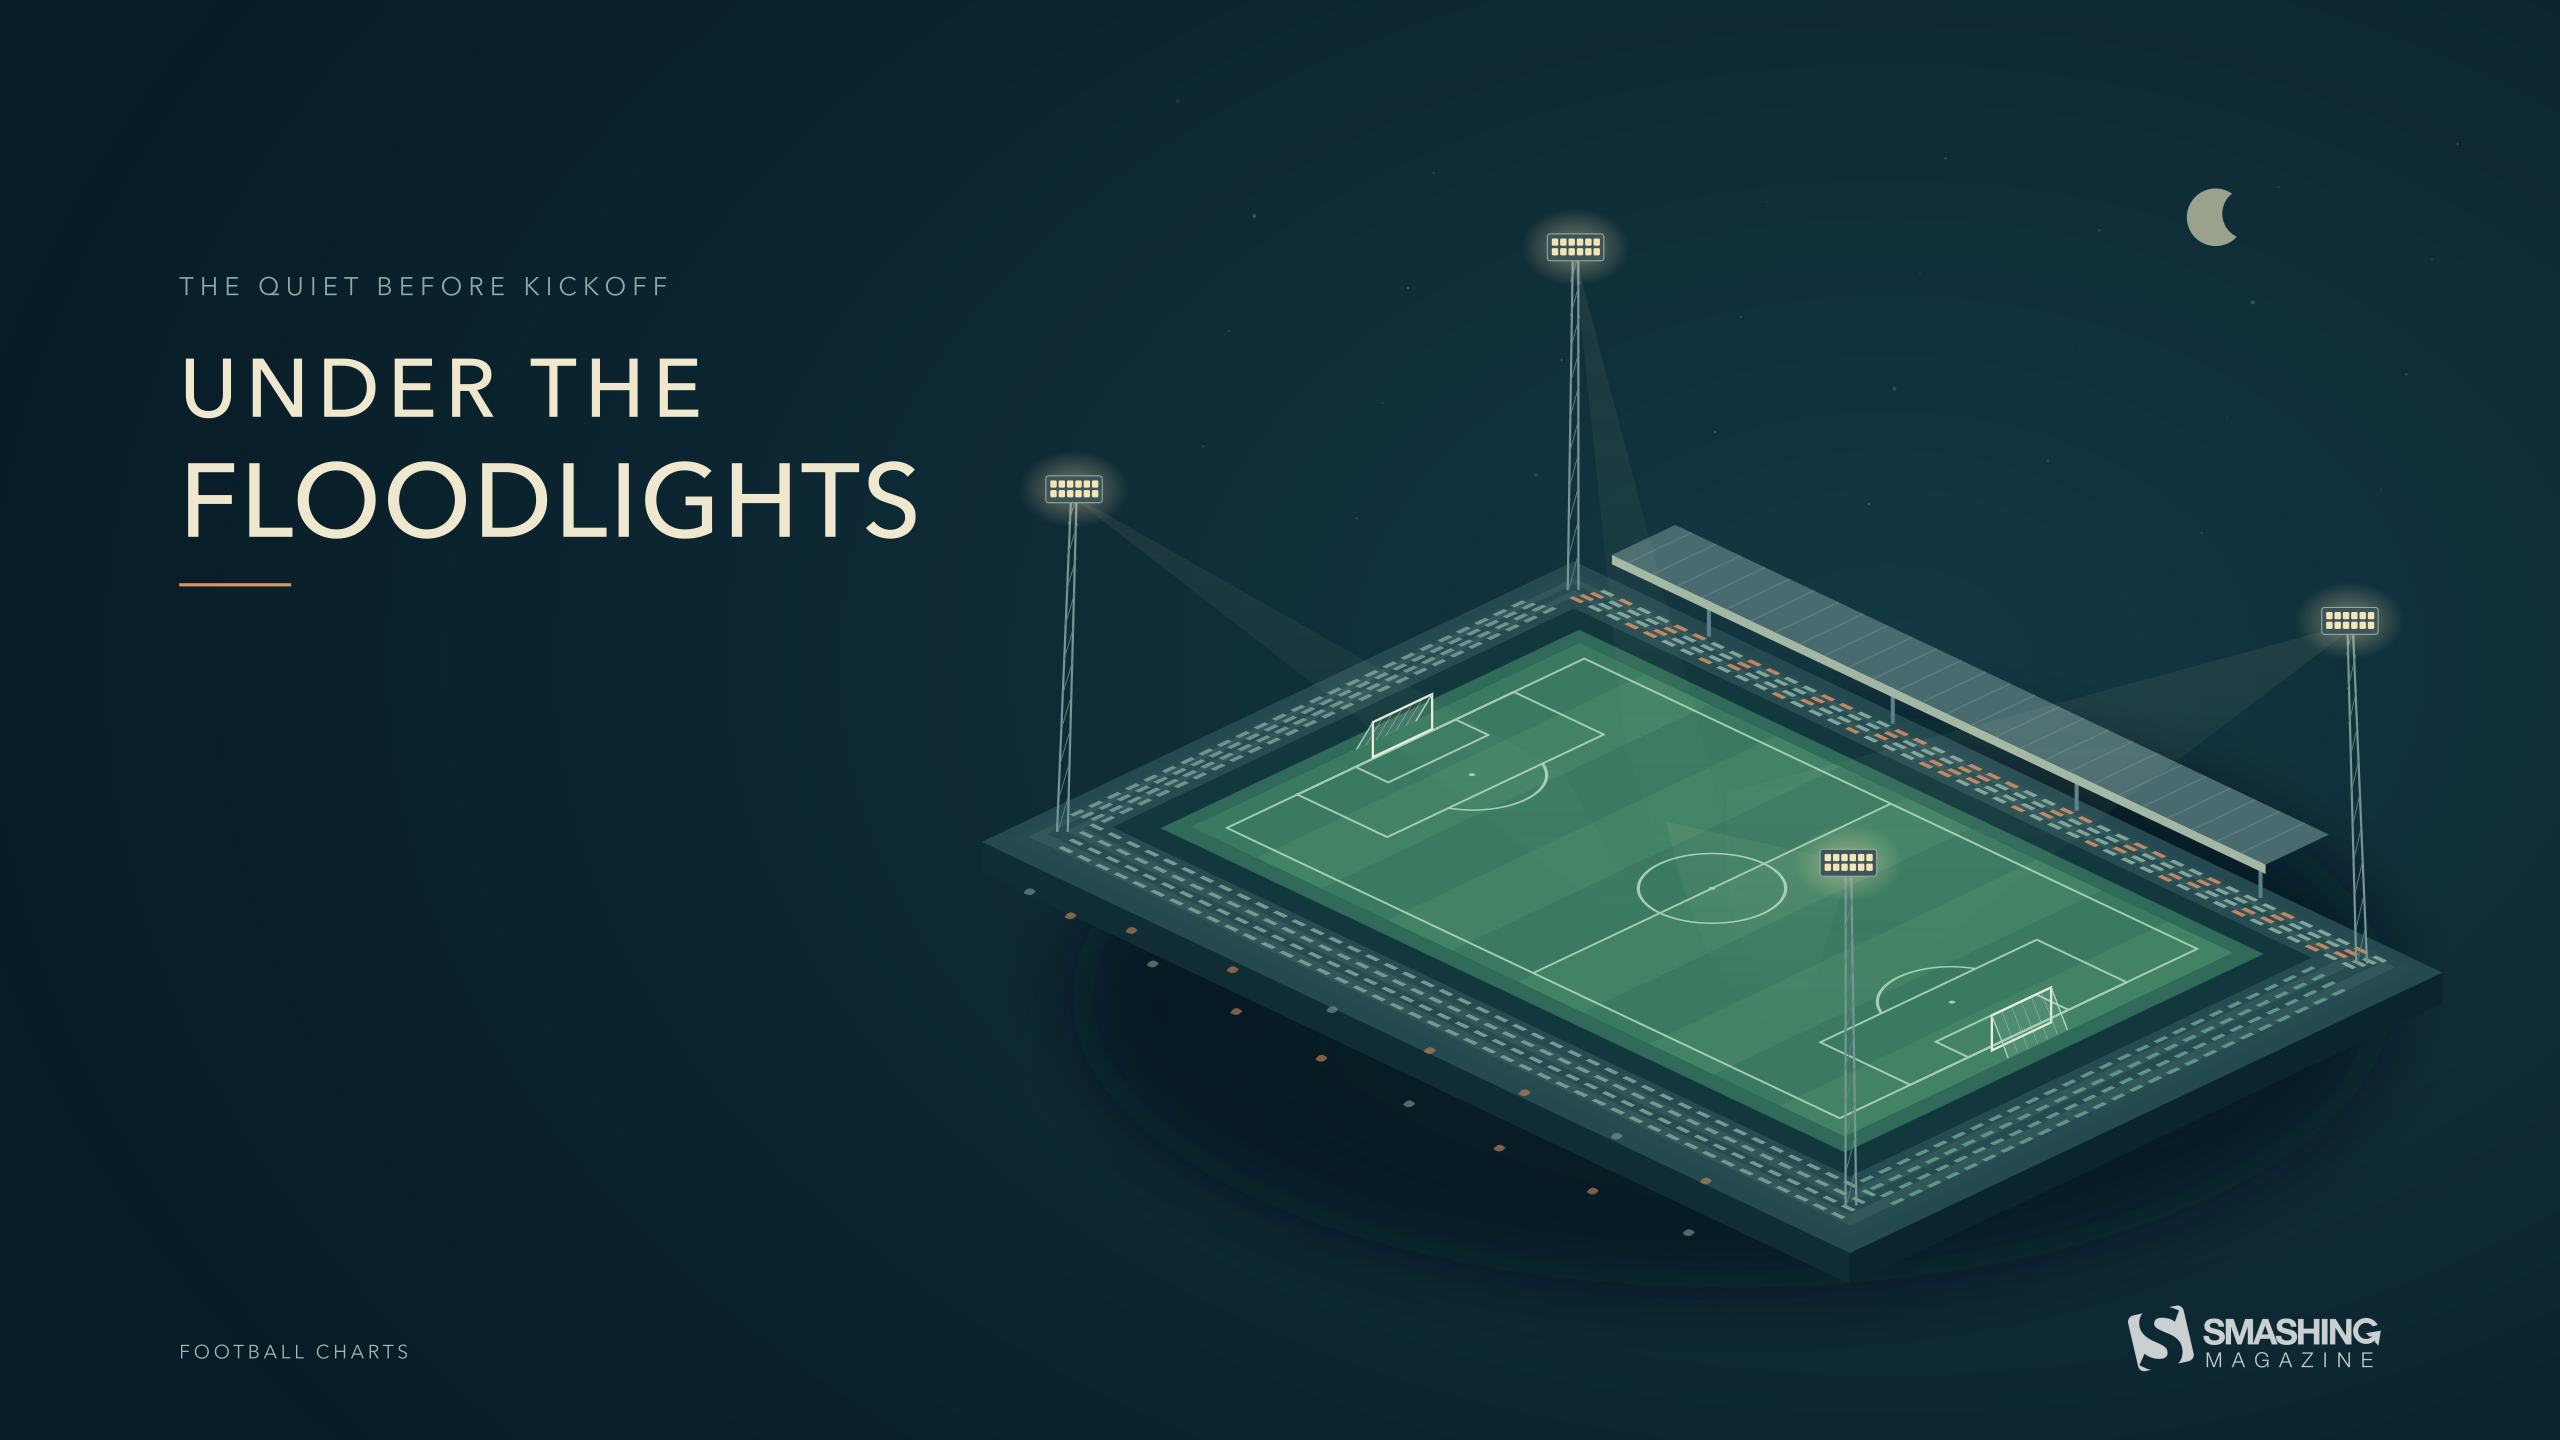
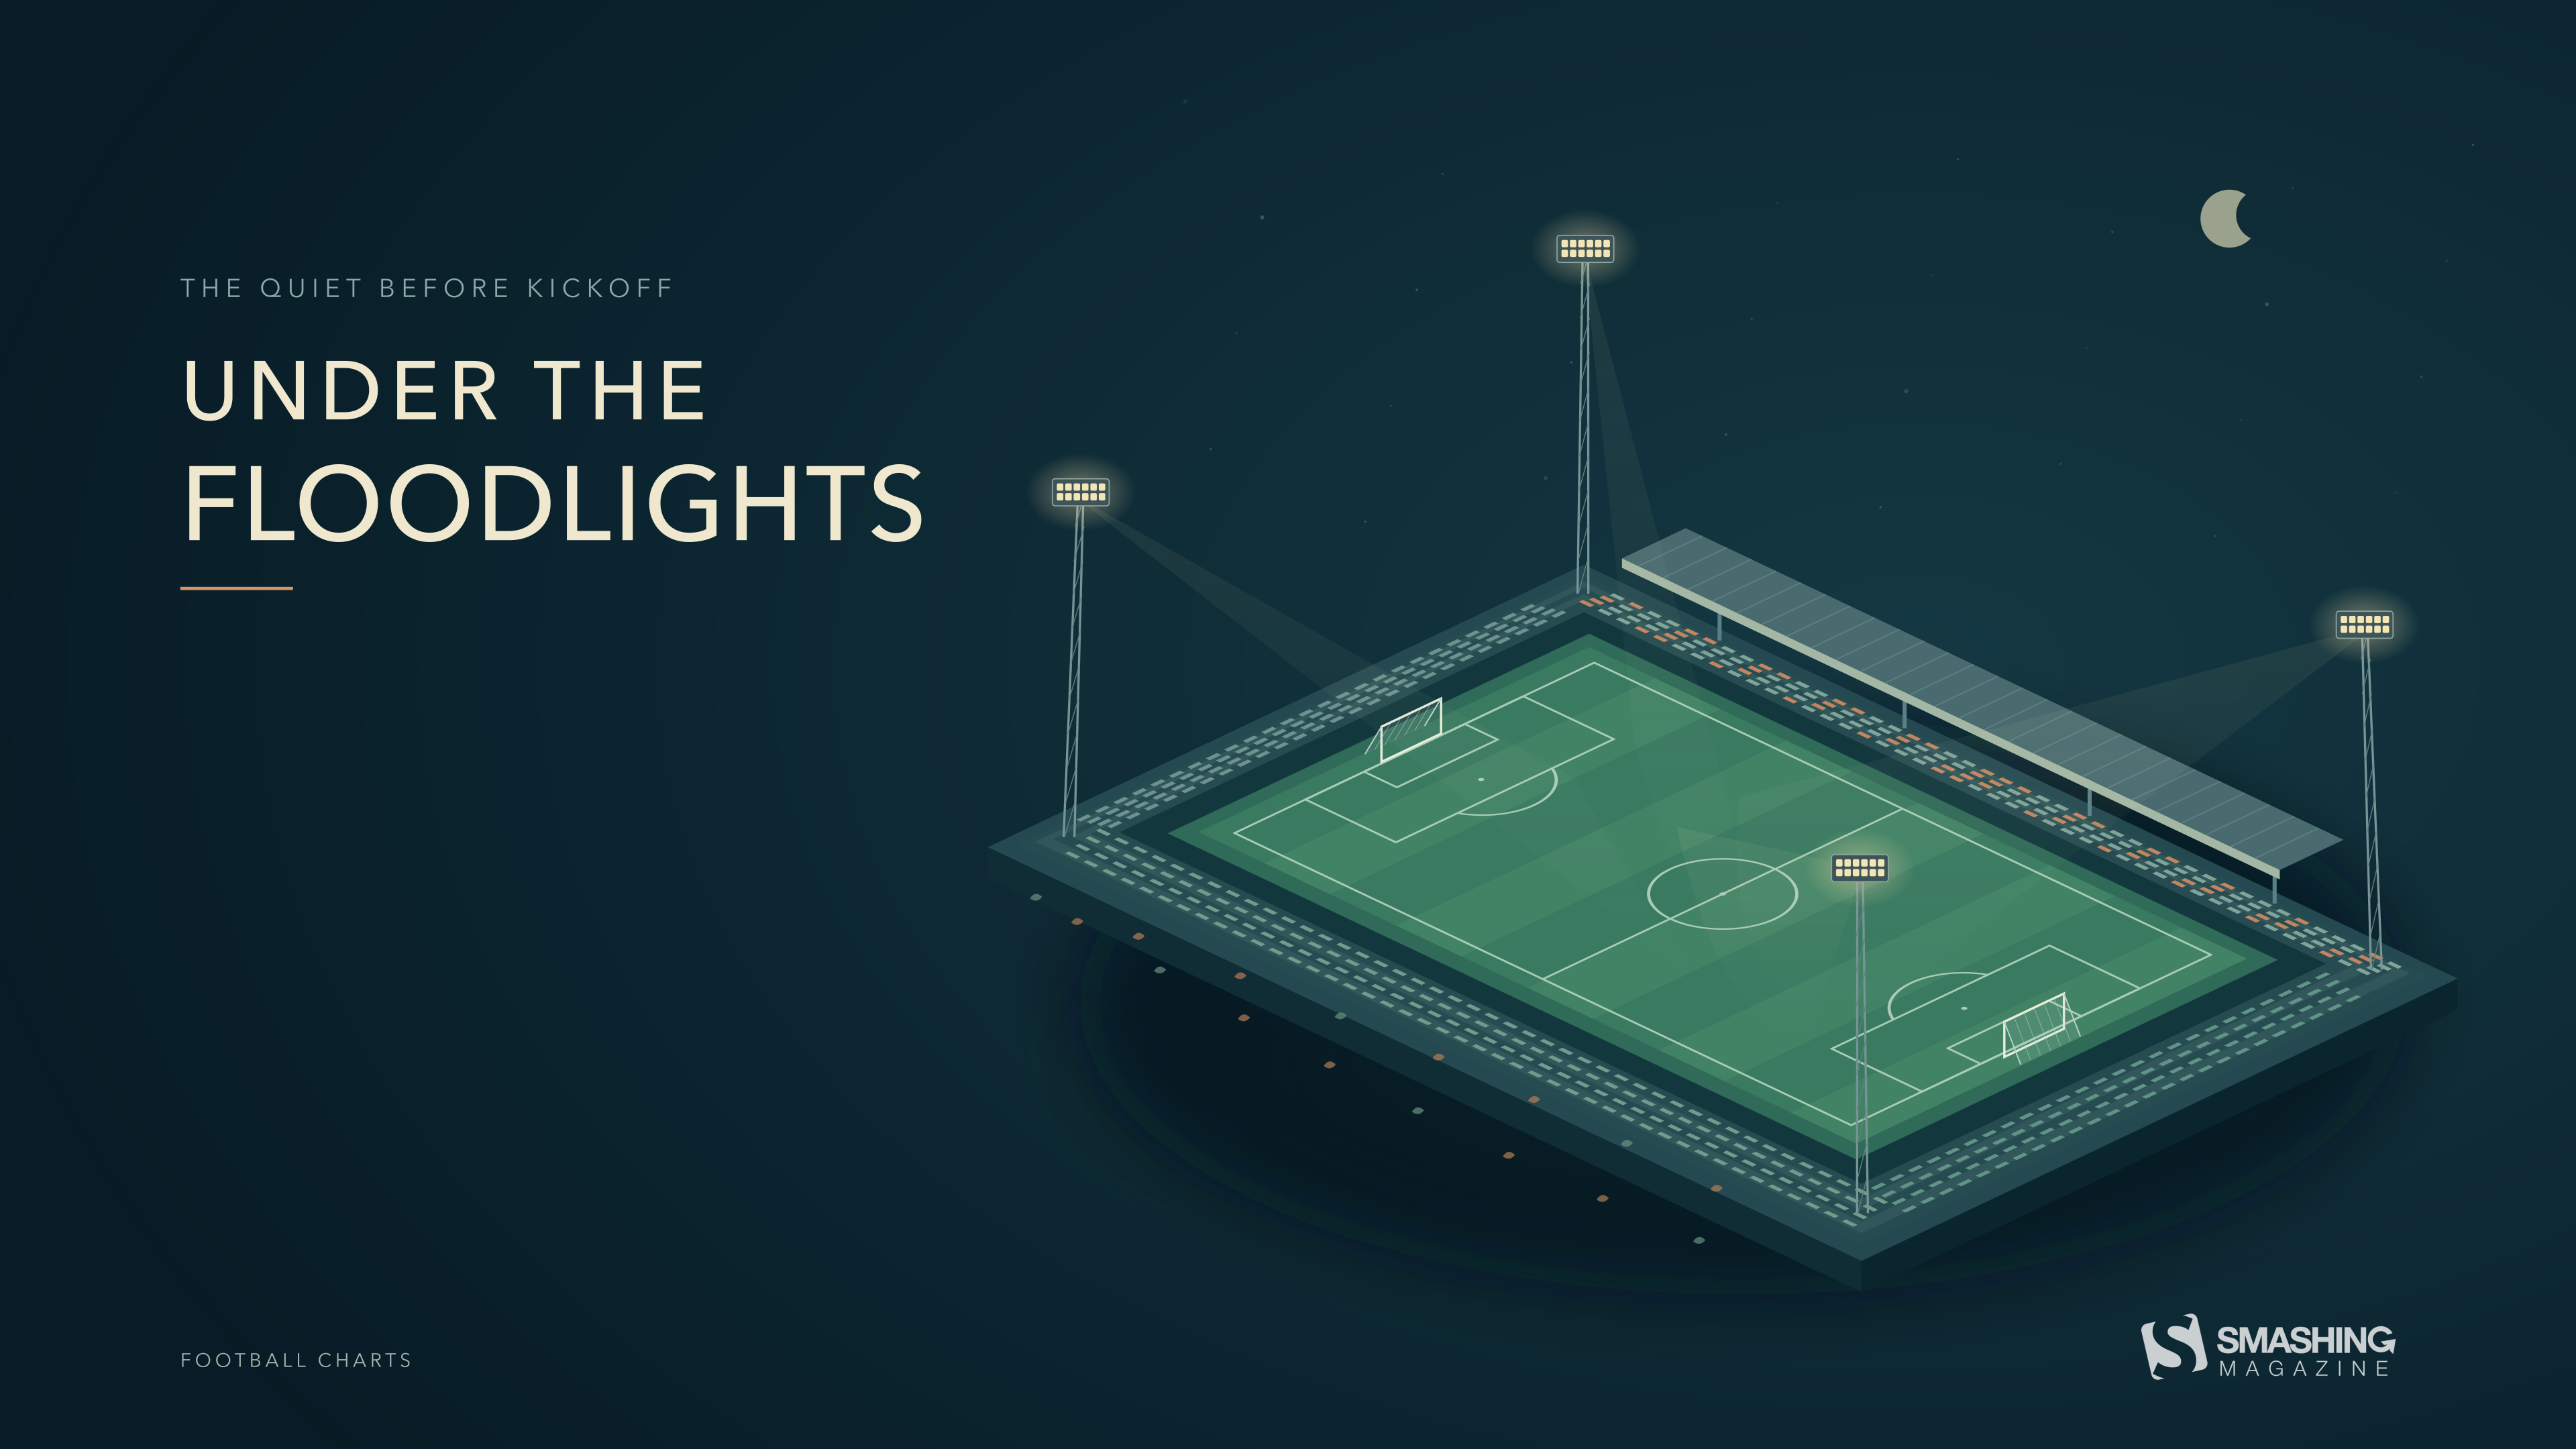
“October football begins under the lights. This geometric illustration captures the quiet moment before kickoff: an empty pitch, warm floodlights, and a dark autumn sky. A few fallen leaves hint at the season, while the open composition leaves room for the everyday things on your desktop.” — Designed by Football Charts from Serbia.
- preview
- with calendar: 320x480, 640x480, 800x480, 800x600, 1024x768, 1024x1024, 1152x864, 1280x720, 1280x800, 1280x960, 1280x1024, 1366x768, 1400x1050, 1440x900, 1600x1200, 1680x1050, 1680x1200, 1920x1080, 1920x1200, 1920x1440, 2560x1440, 3840x2160
- without calendar: 320x480, 640x480, 800x480, 800x600, 1024x768, 1024x1024, 1152x864, 1280x720, 1280x800, 1280x960, 1280x1024, 1366x768, 1400x1050, 1440x900, 1600x1200, 1680x1050, 1680x1200, 1920x1080, 1920x1200, 1920x1440, 2560x1440, 3840x2160
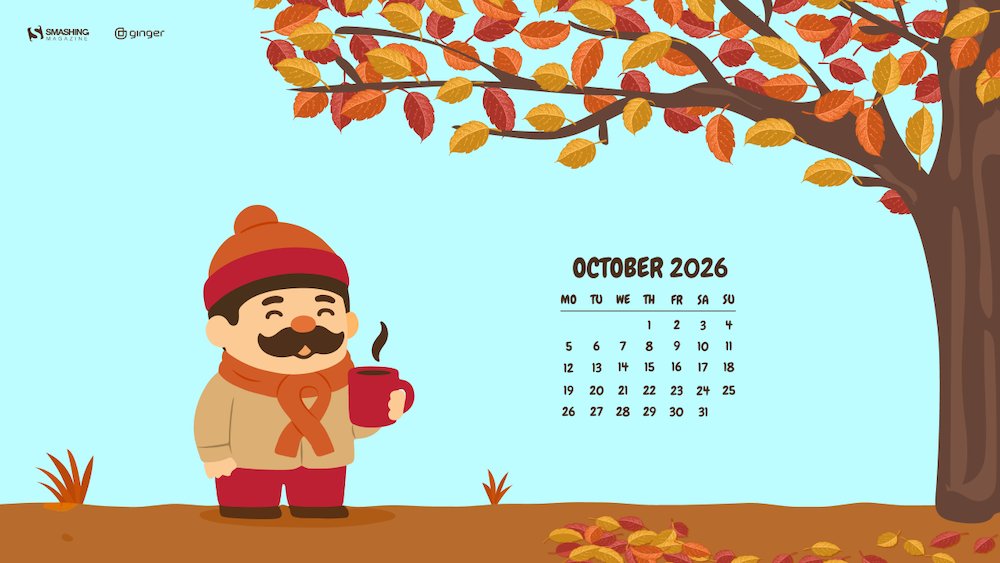
“October is here, which means colder mornings, warmer clothes, and coffee that somehow tastes better outside. A small autumn scene for one of the coziest months of the year.” — Designed by Ginger IT Solutions from Serbia.
- preview
- with calendar: 320x480, 640x480, 800x480, 800x600, 1024x768, 1024x1024, 1152x864, 1280x720, 1280x800, 1280x960, 1280x1024, 1400x1050, 1440x900, 1600x1200, 1680x1050, 1680x1200, 1920x1080, 1920x1200, 1920x1440, 2560x1440
- without calendar: 320x480, 640x480, 800x480, 800x600, 1024x768, 1024x1024, 1152x864, 1280x720, 1280x800, 1280x960, 1280x1024, 1400x1050, 1440x900, 1600x1200, 1680x1050, 1680x1200, 1920x1080, 1920x1200, 1920x1440, 2560x1440
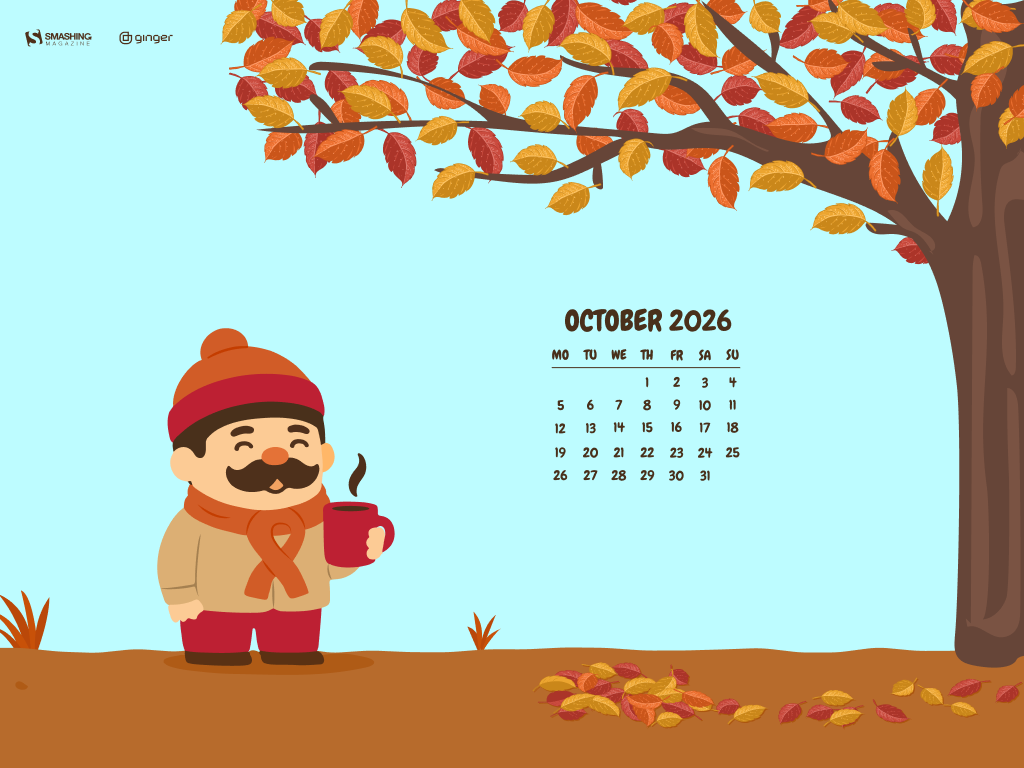
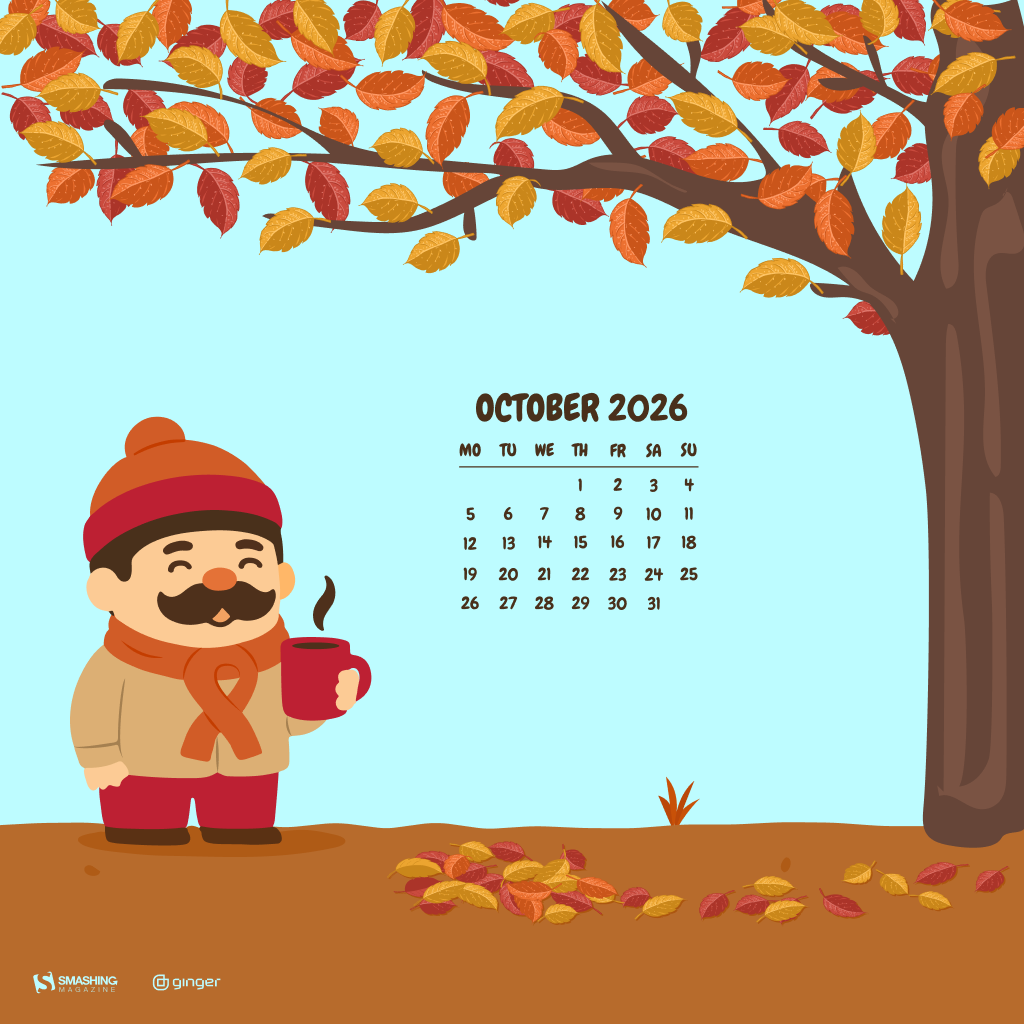
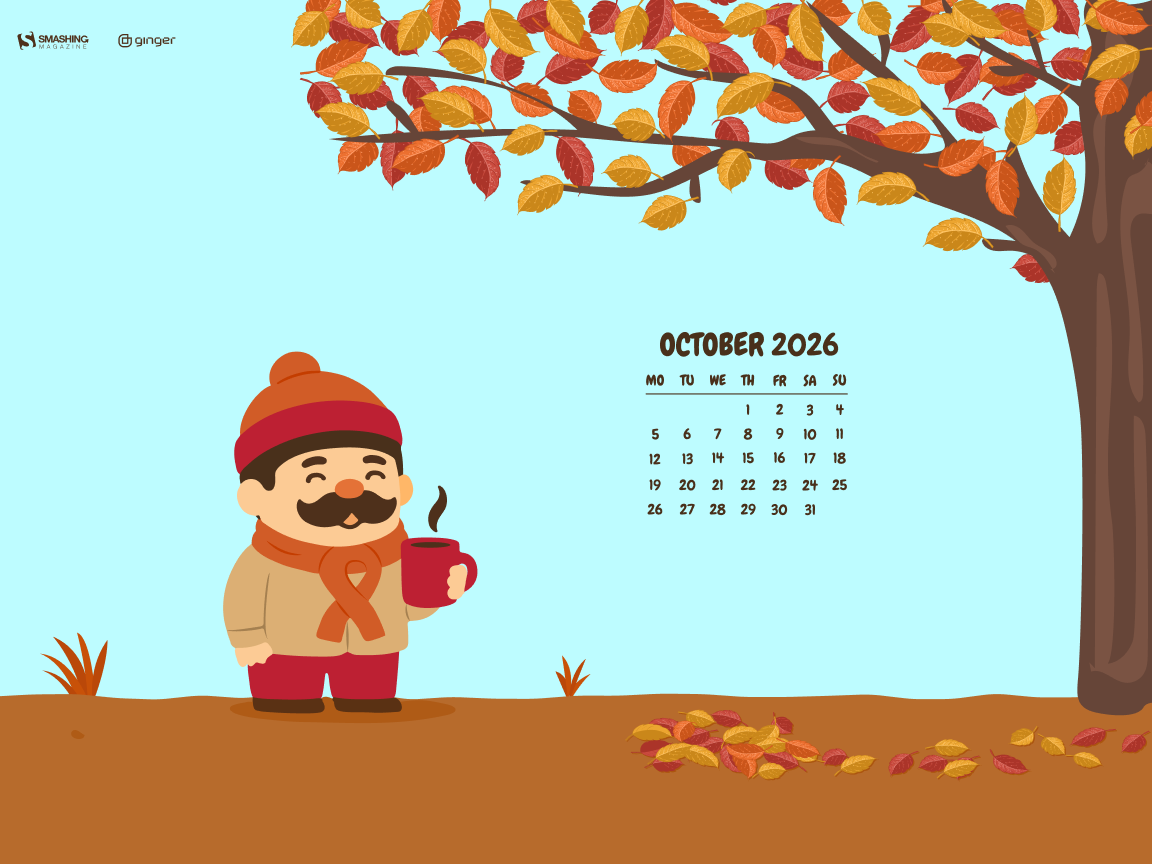
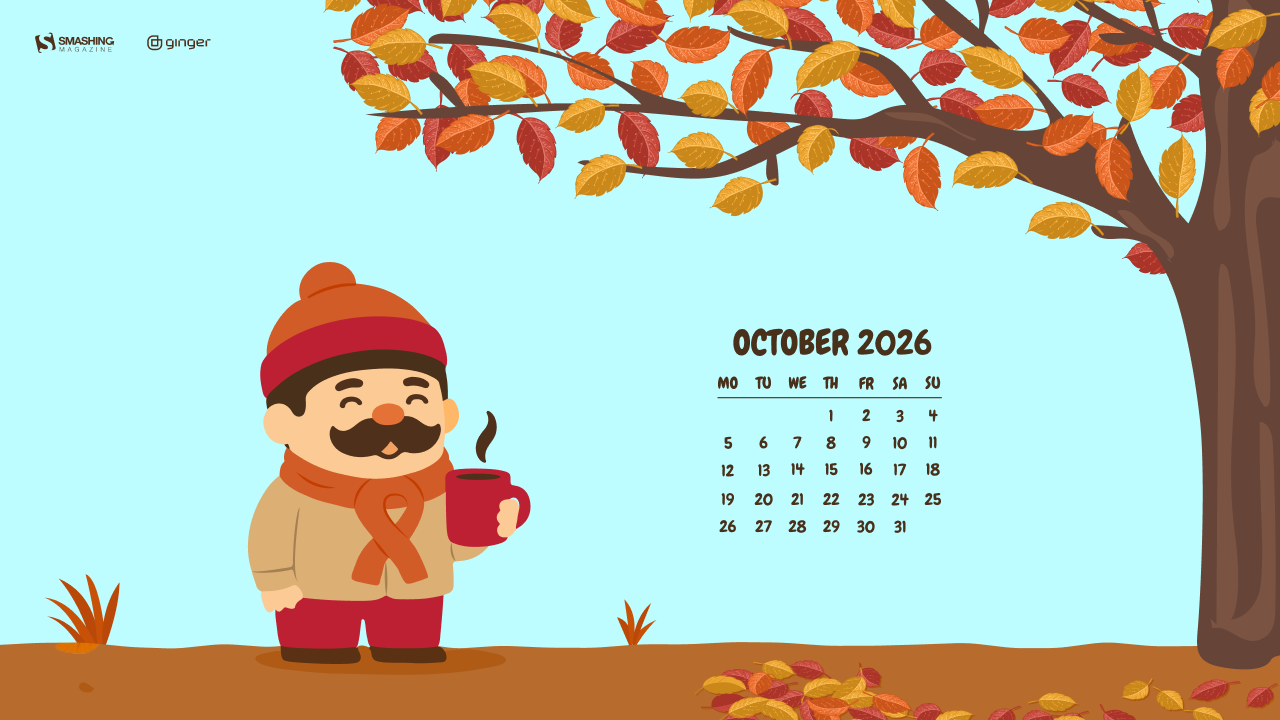
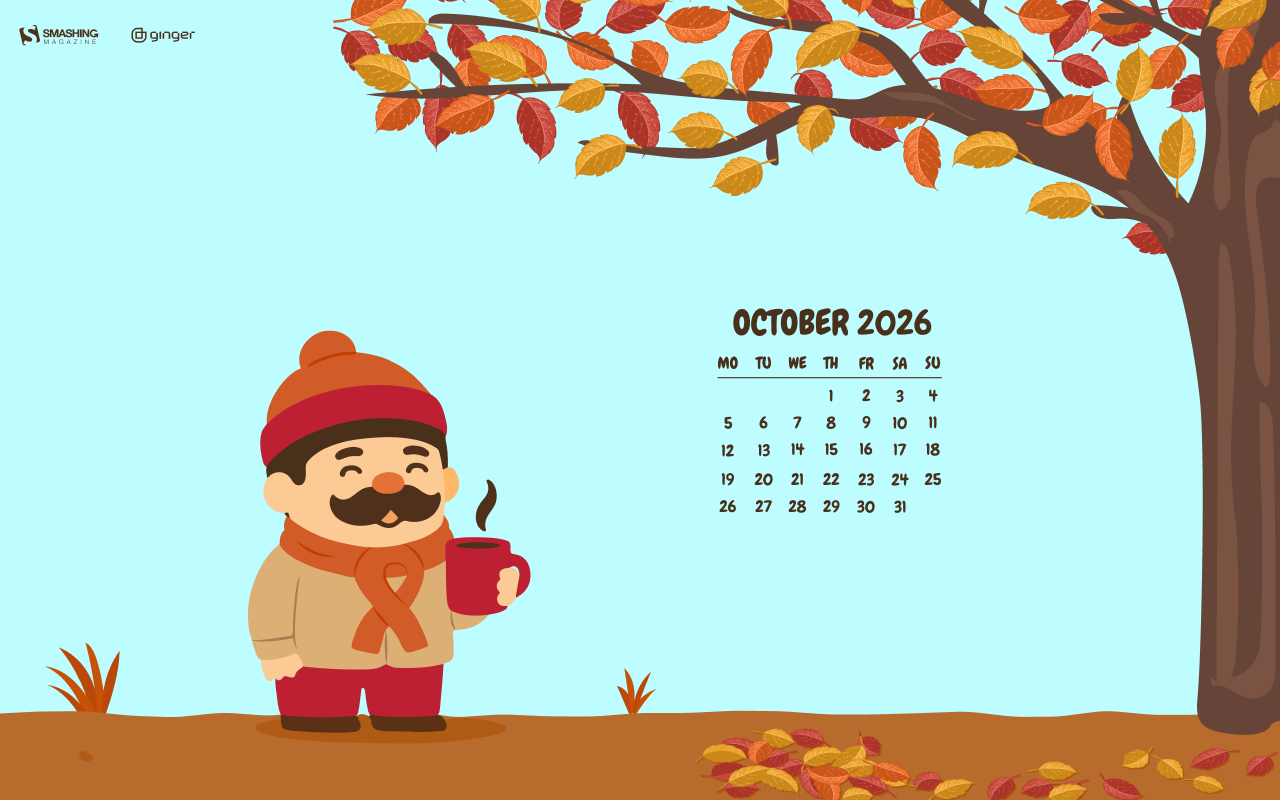
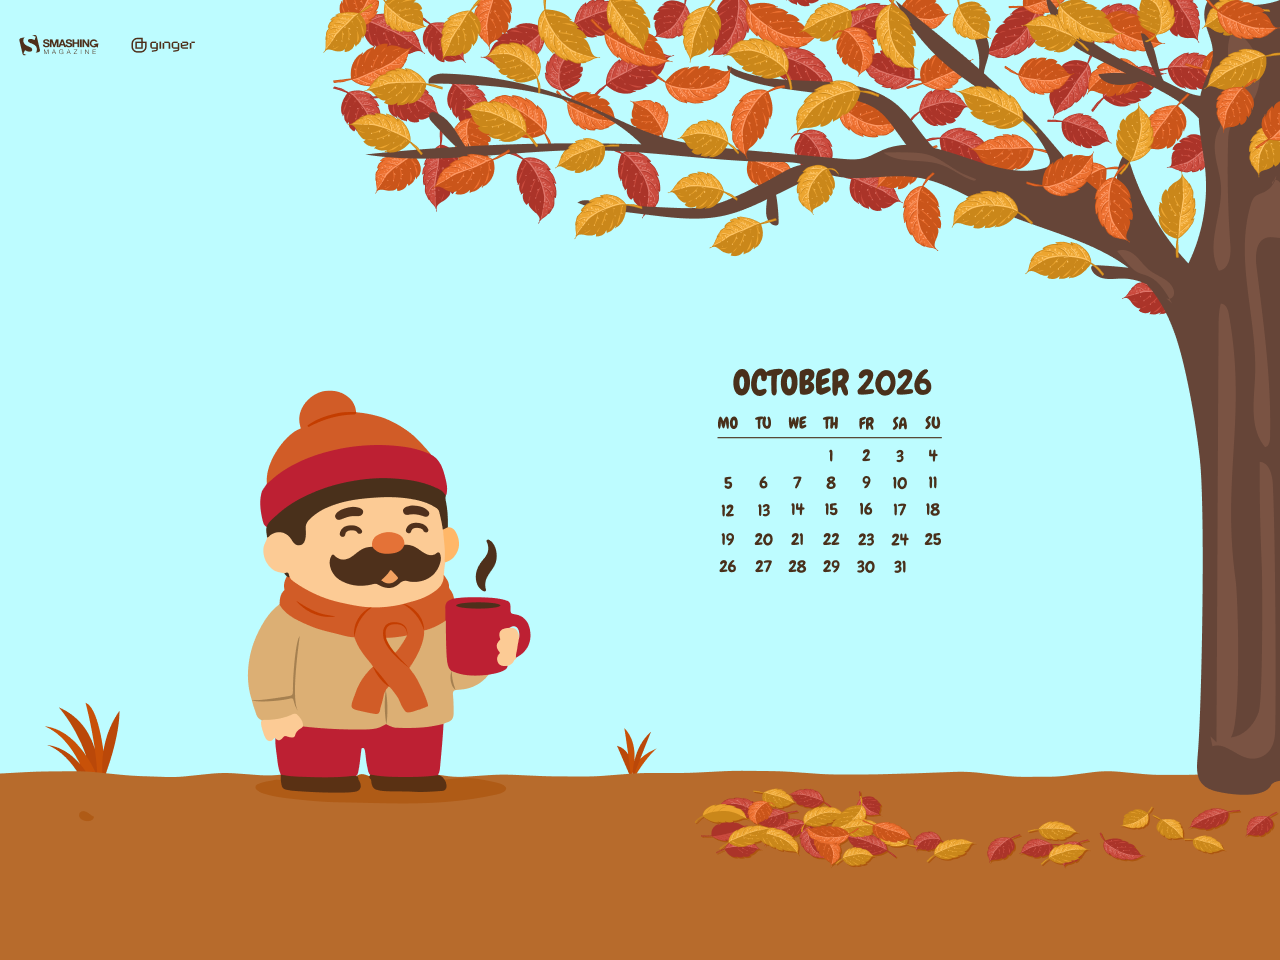
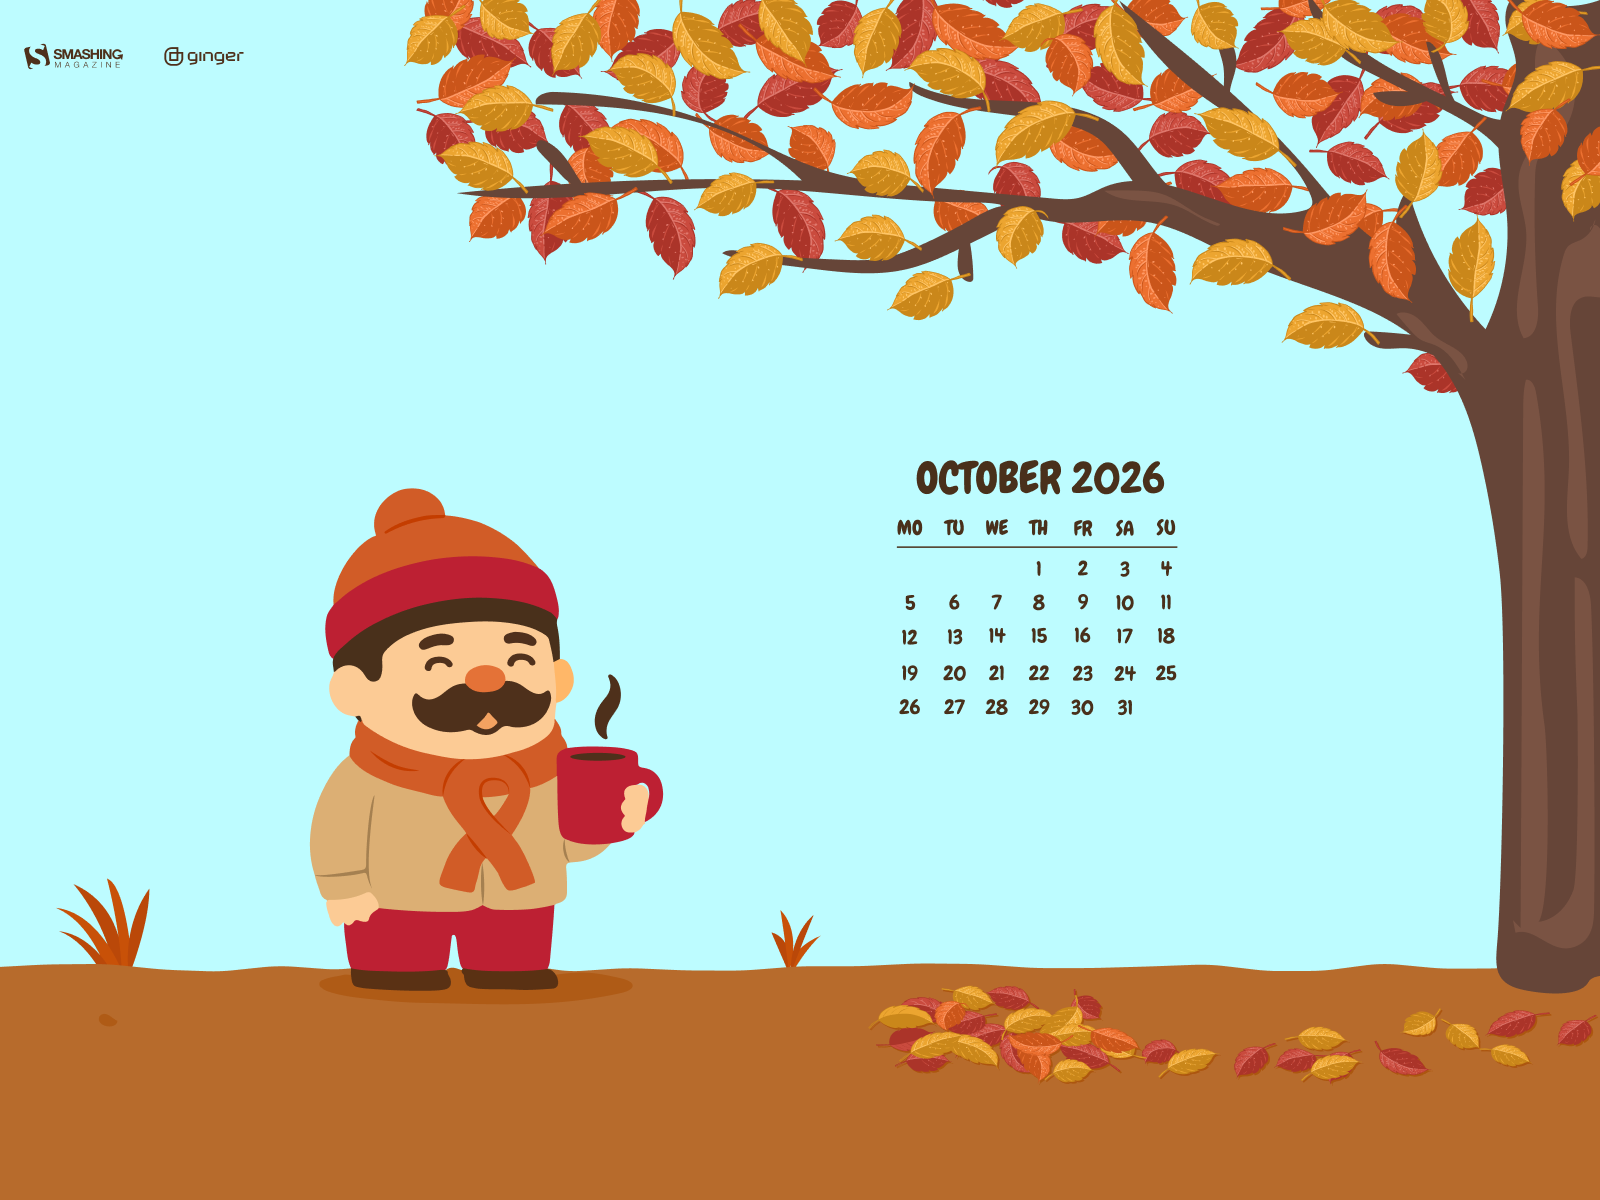
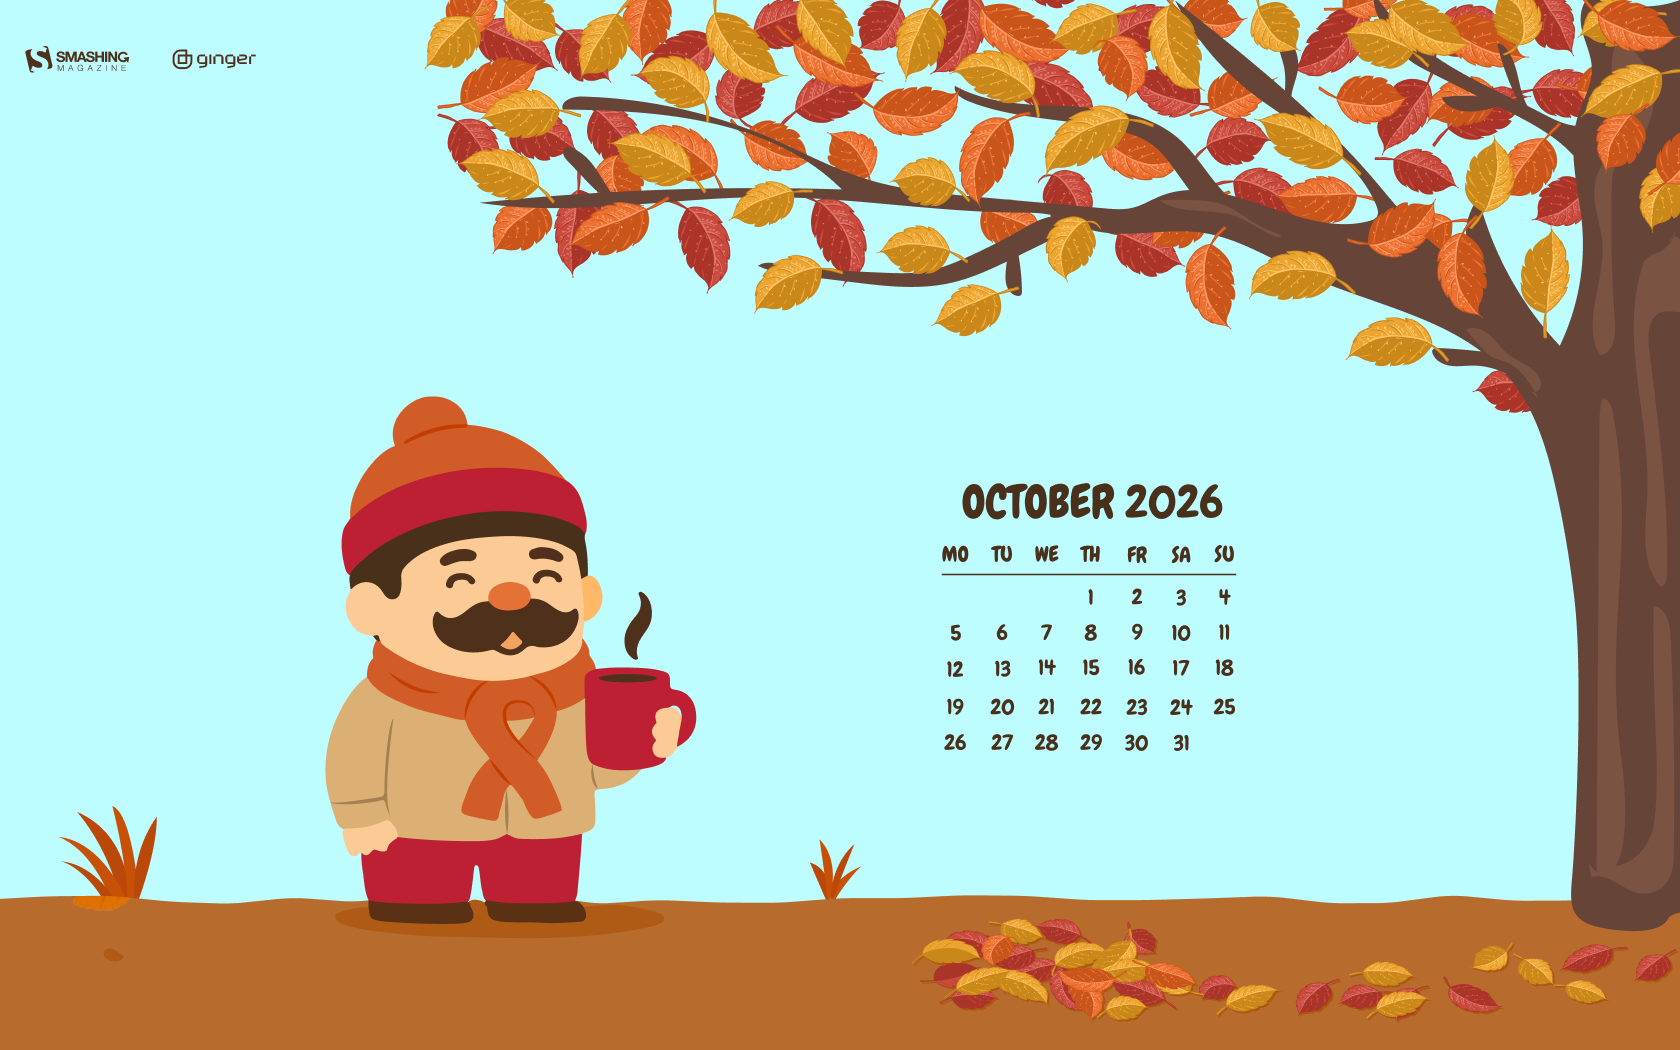
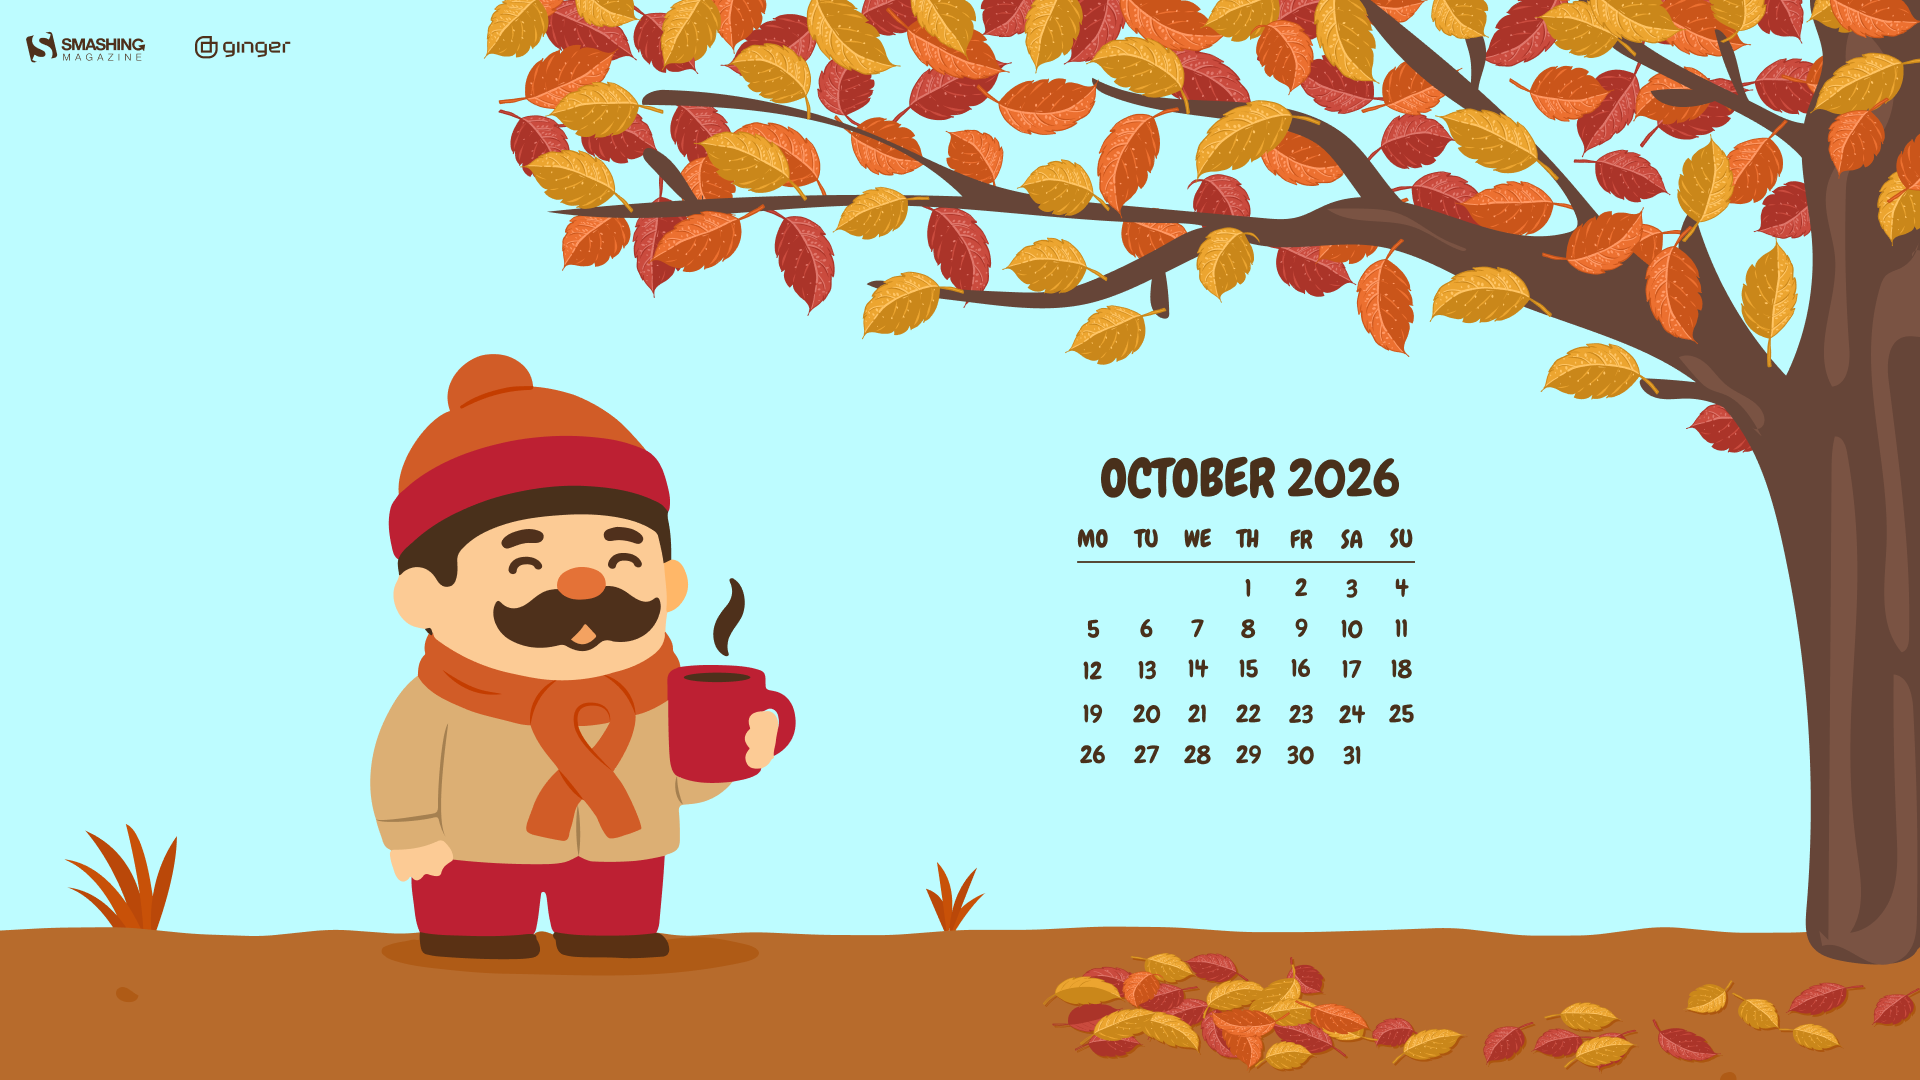
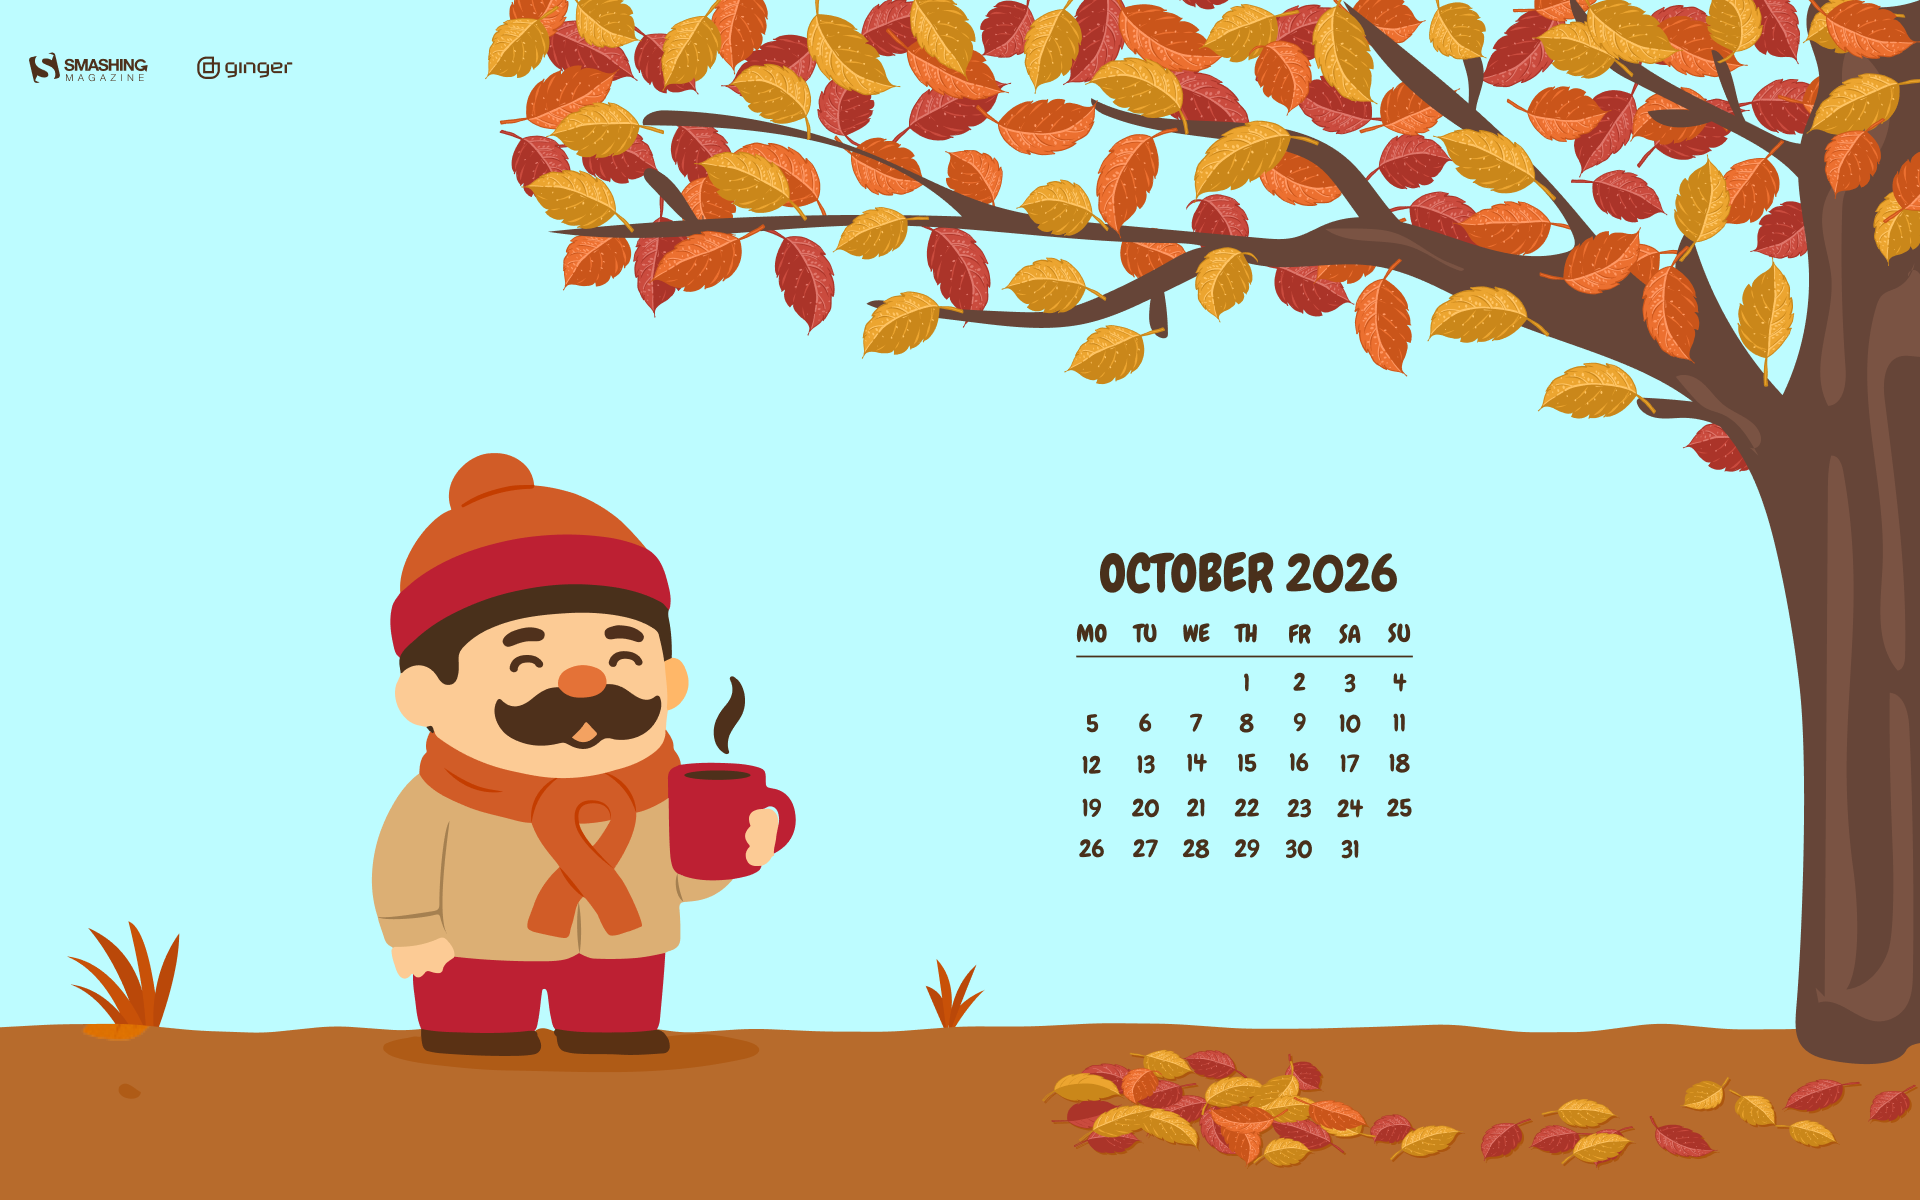
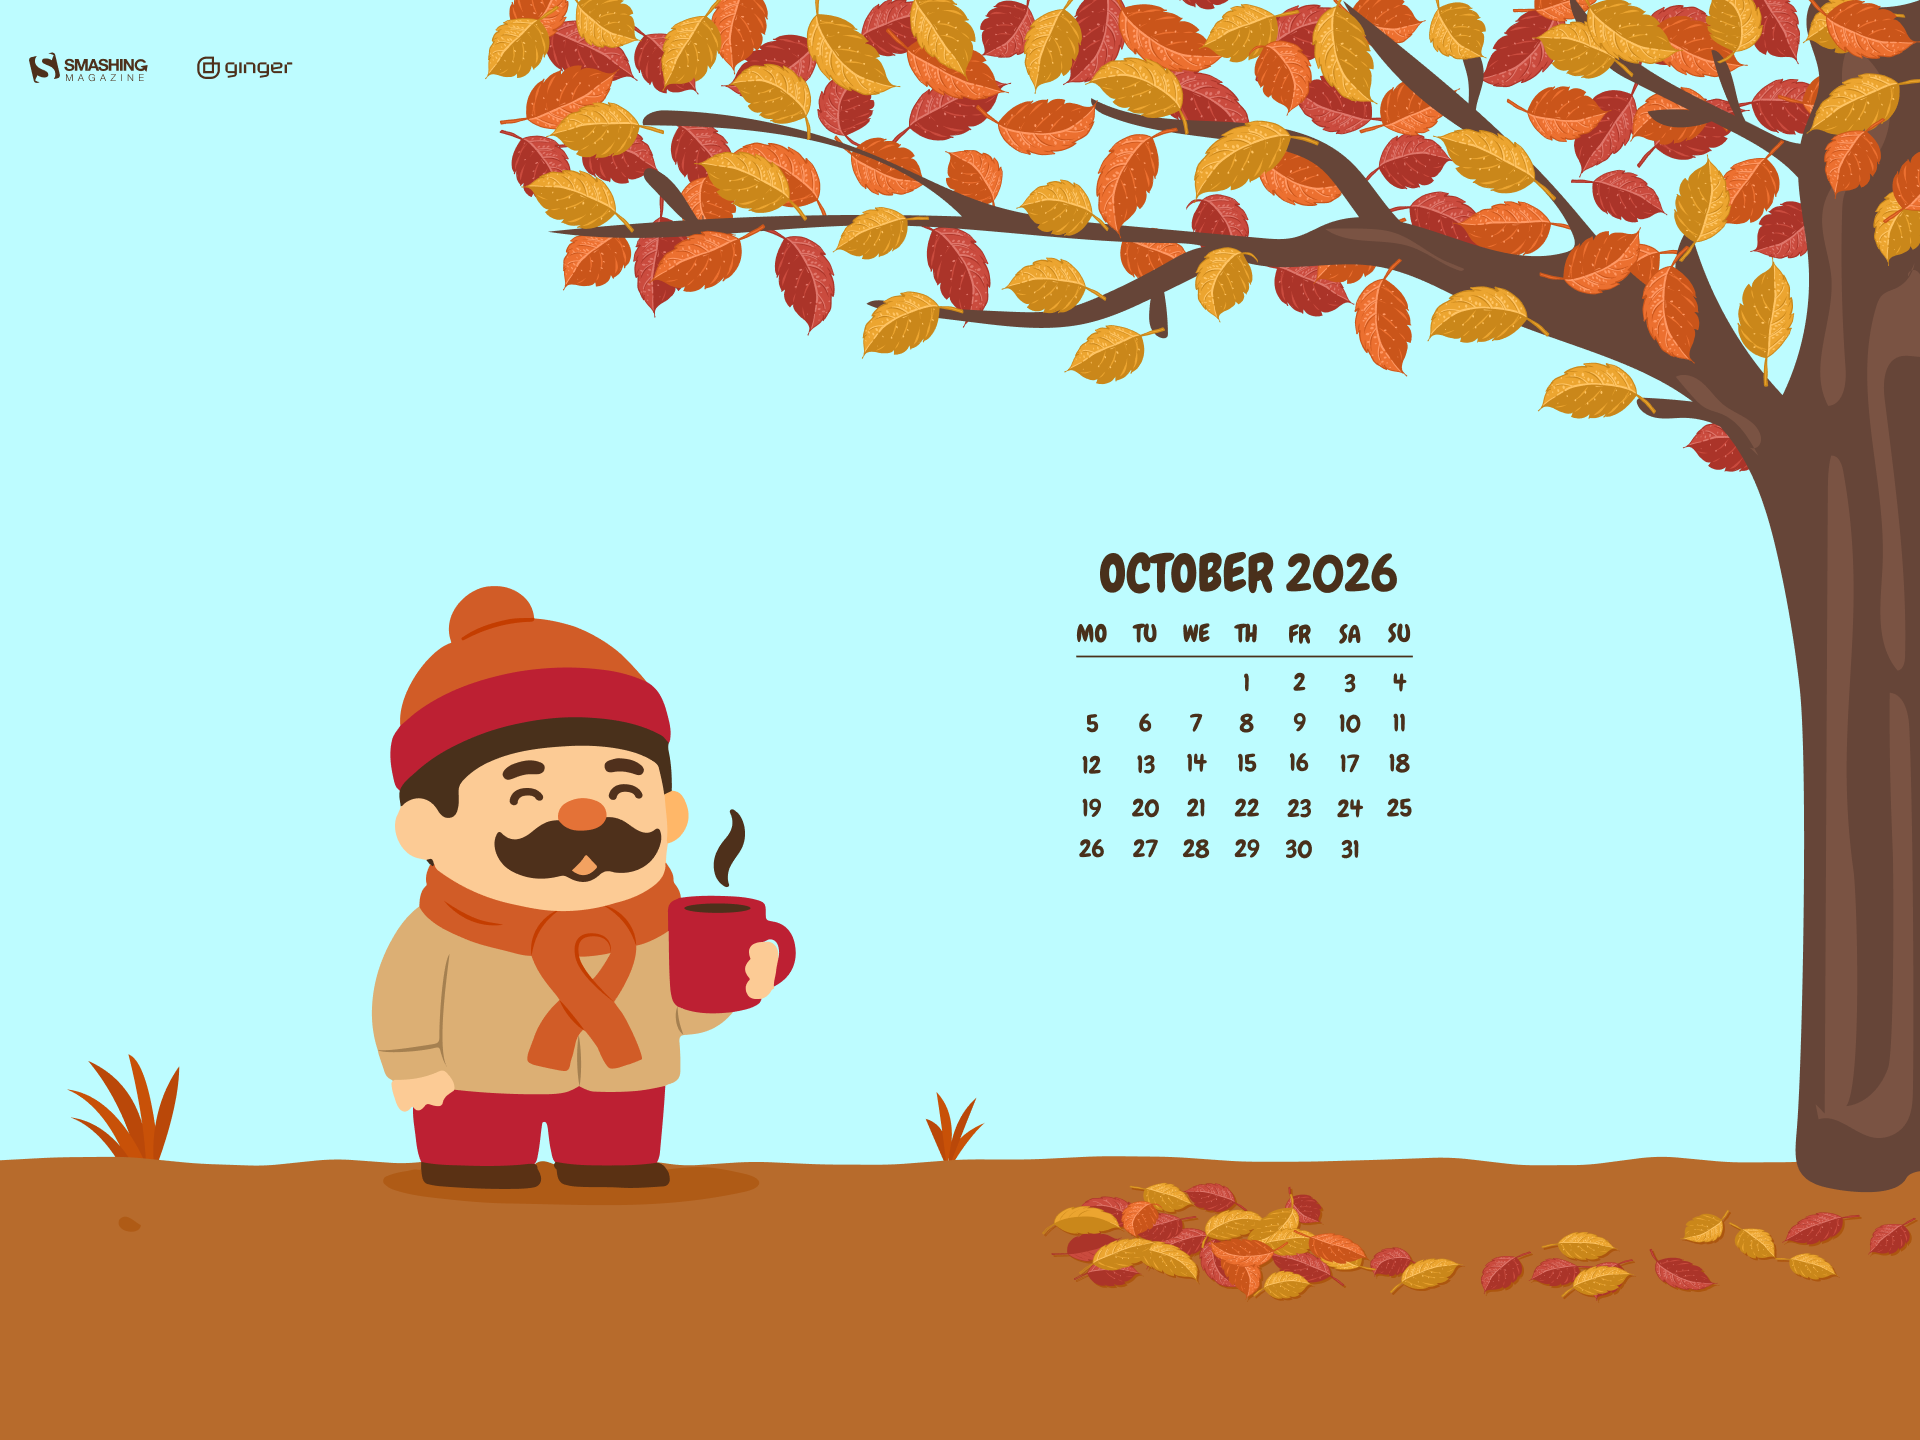
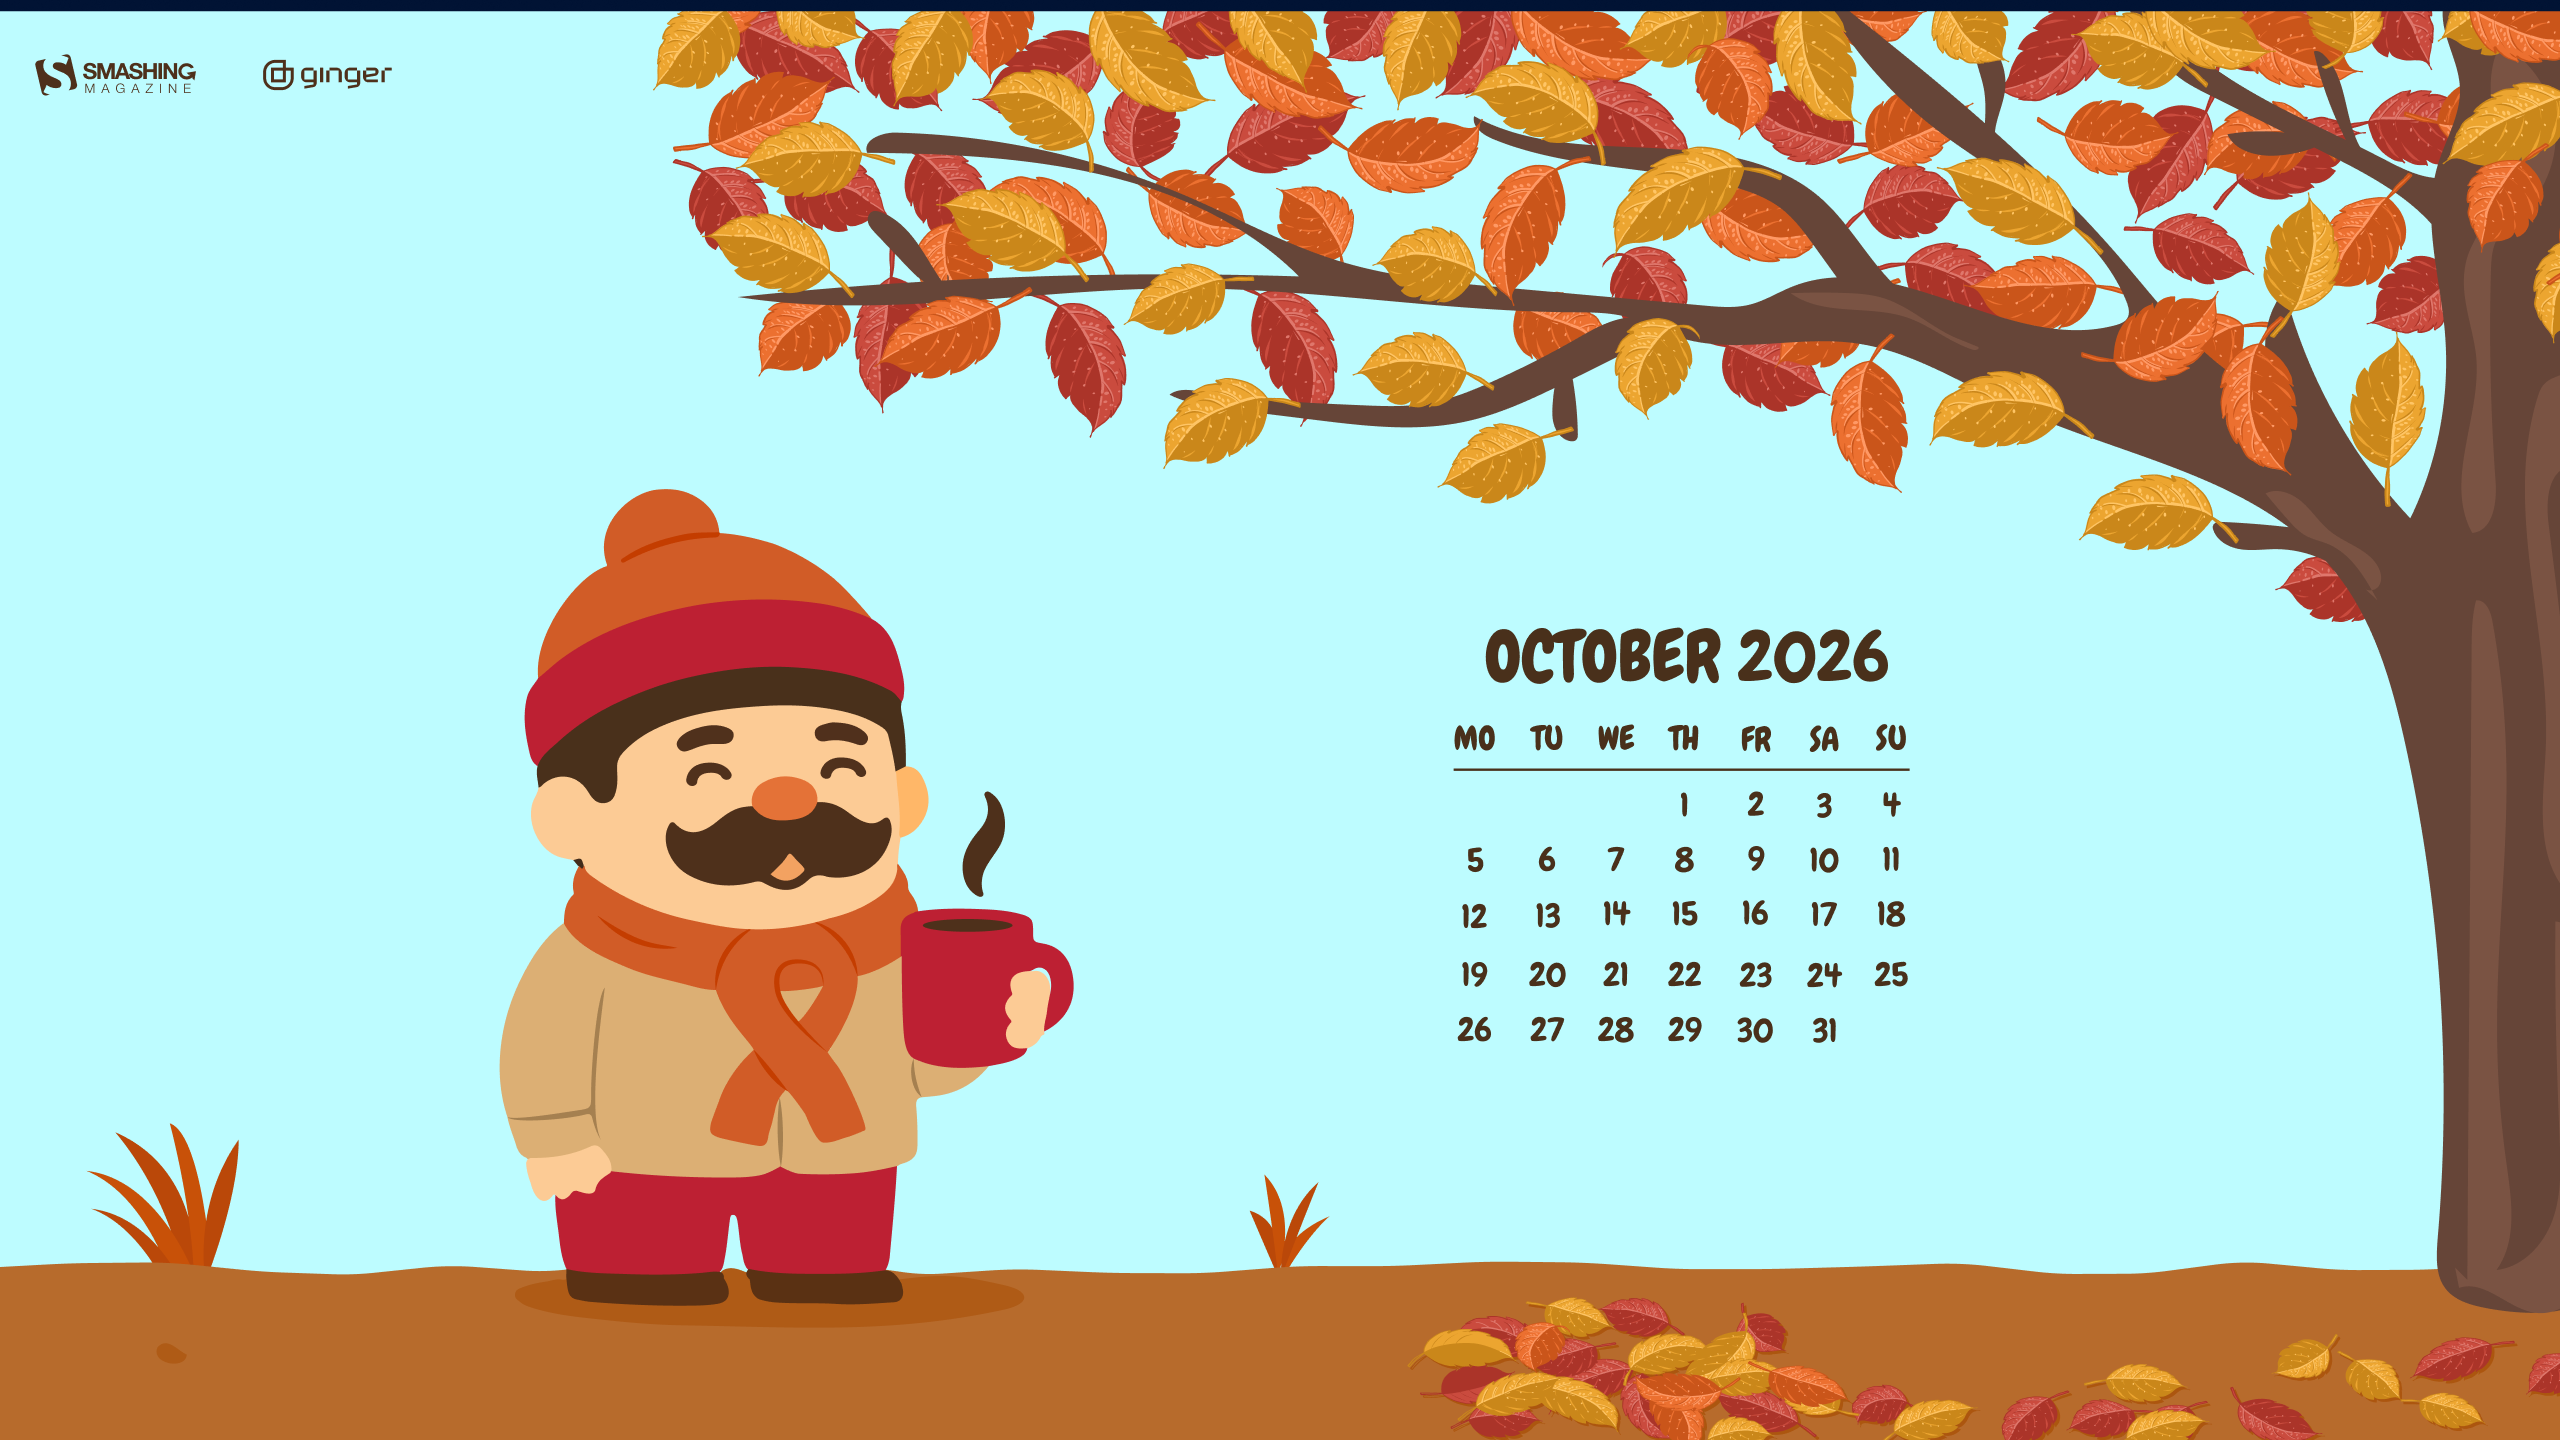








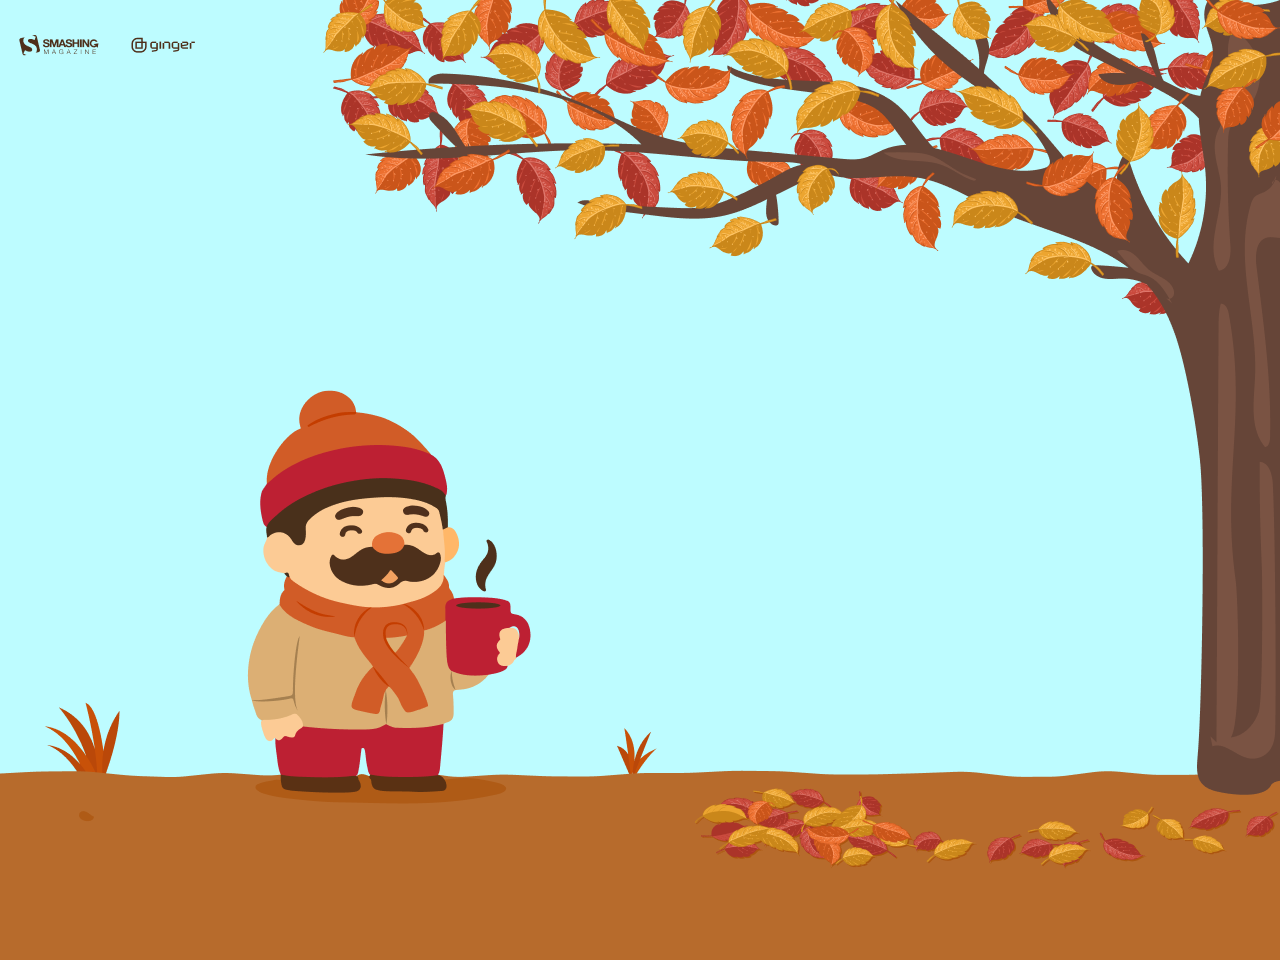






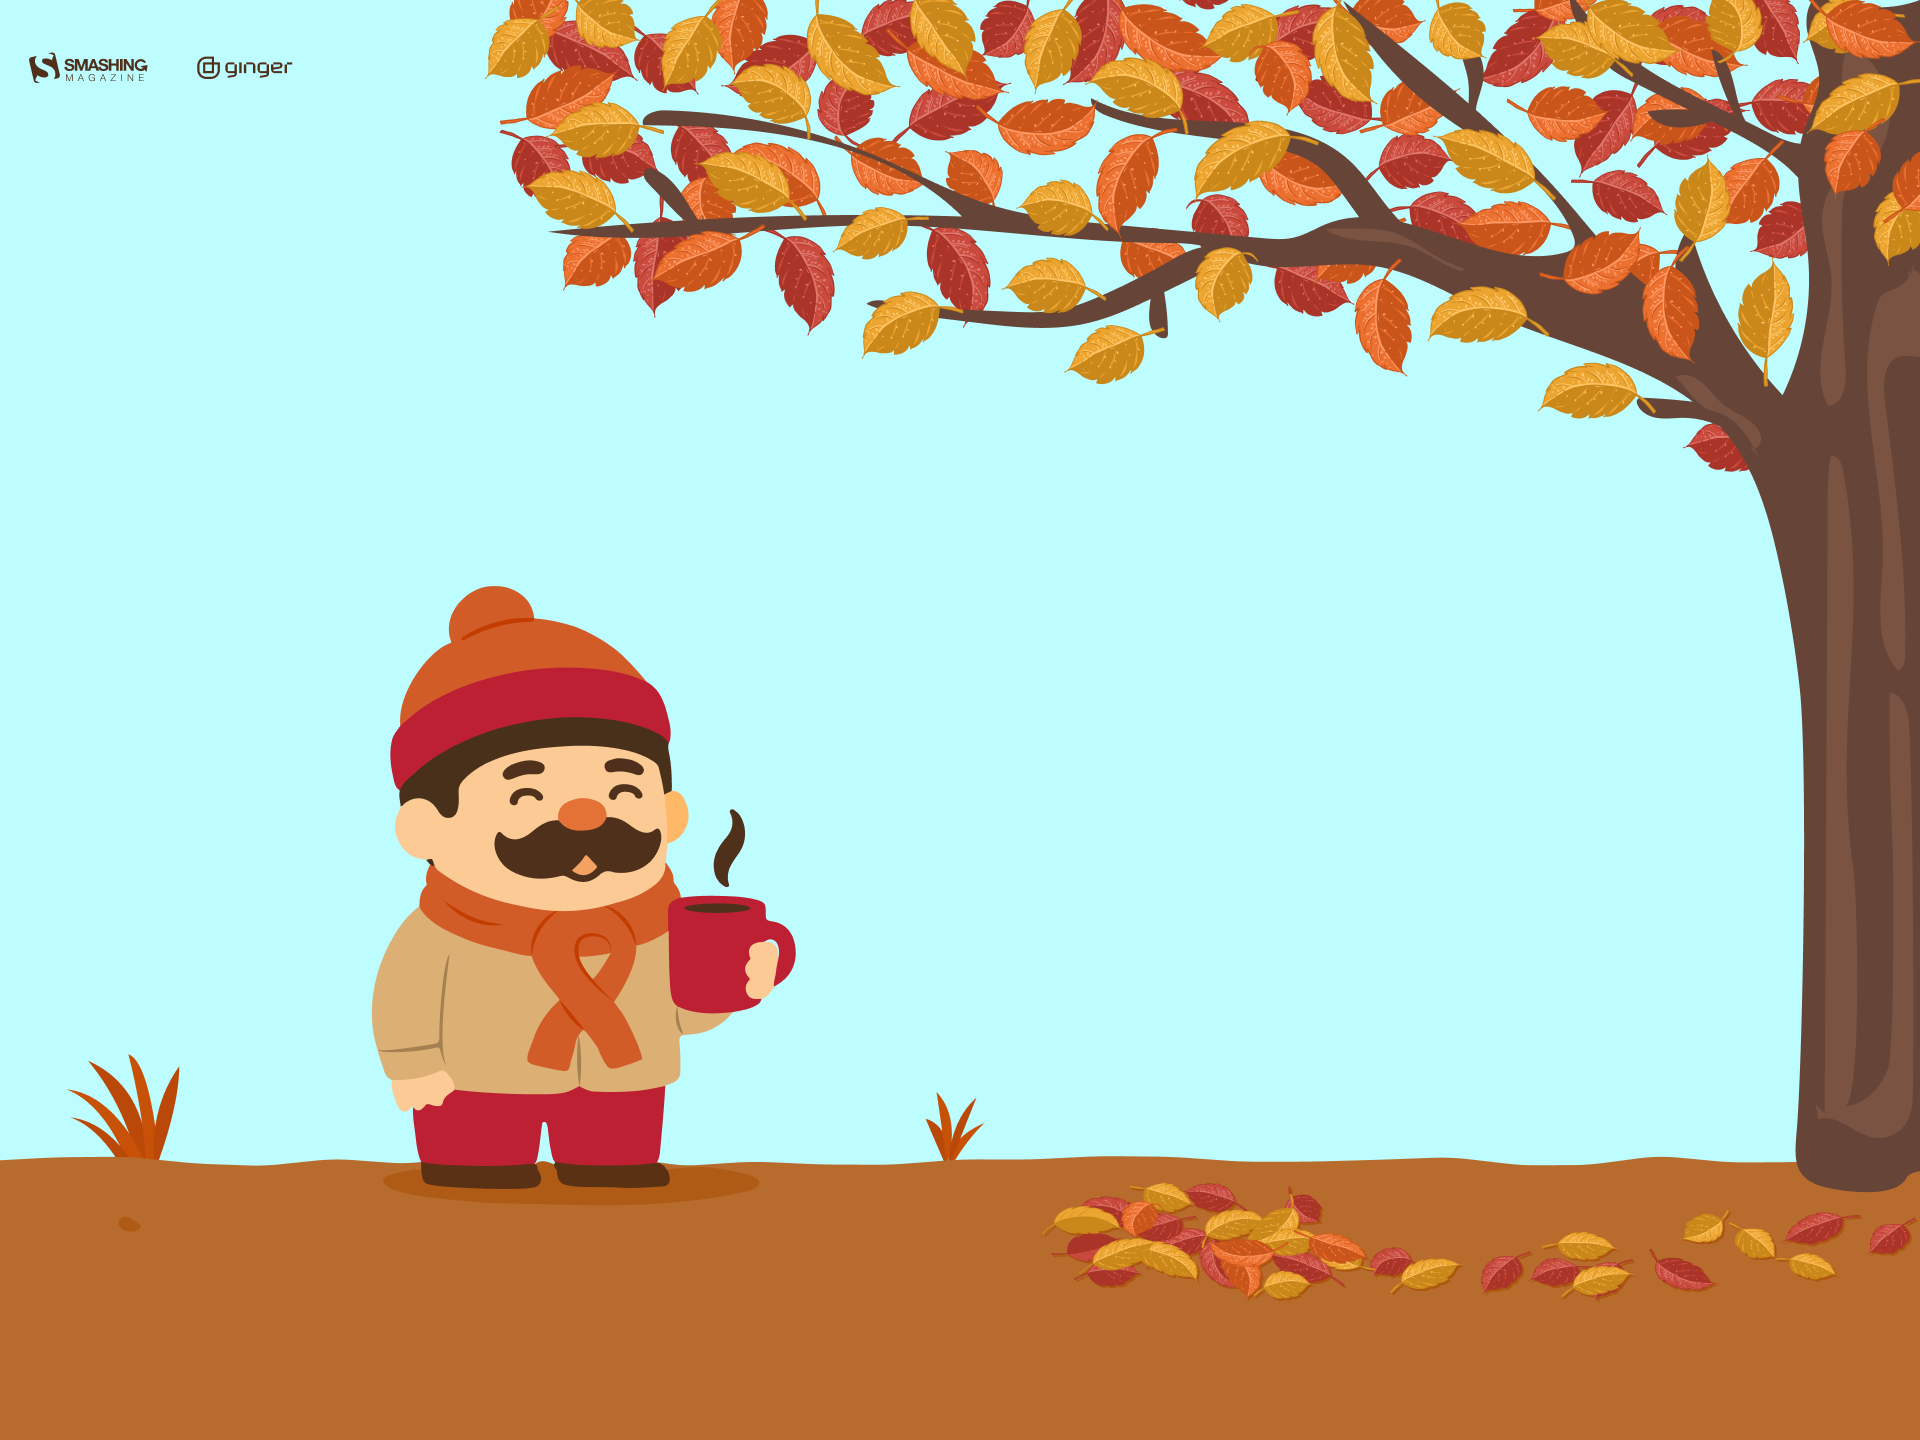
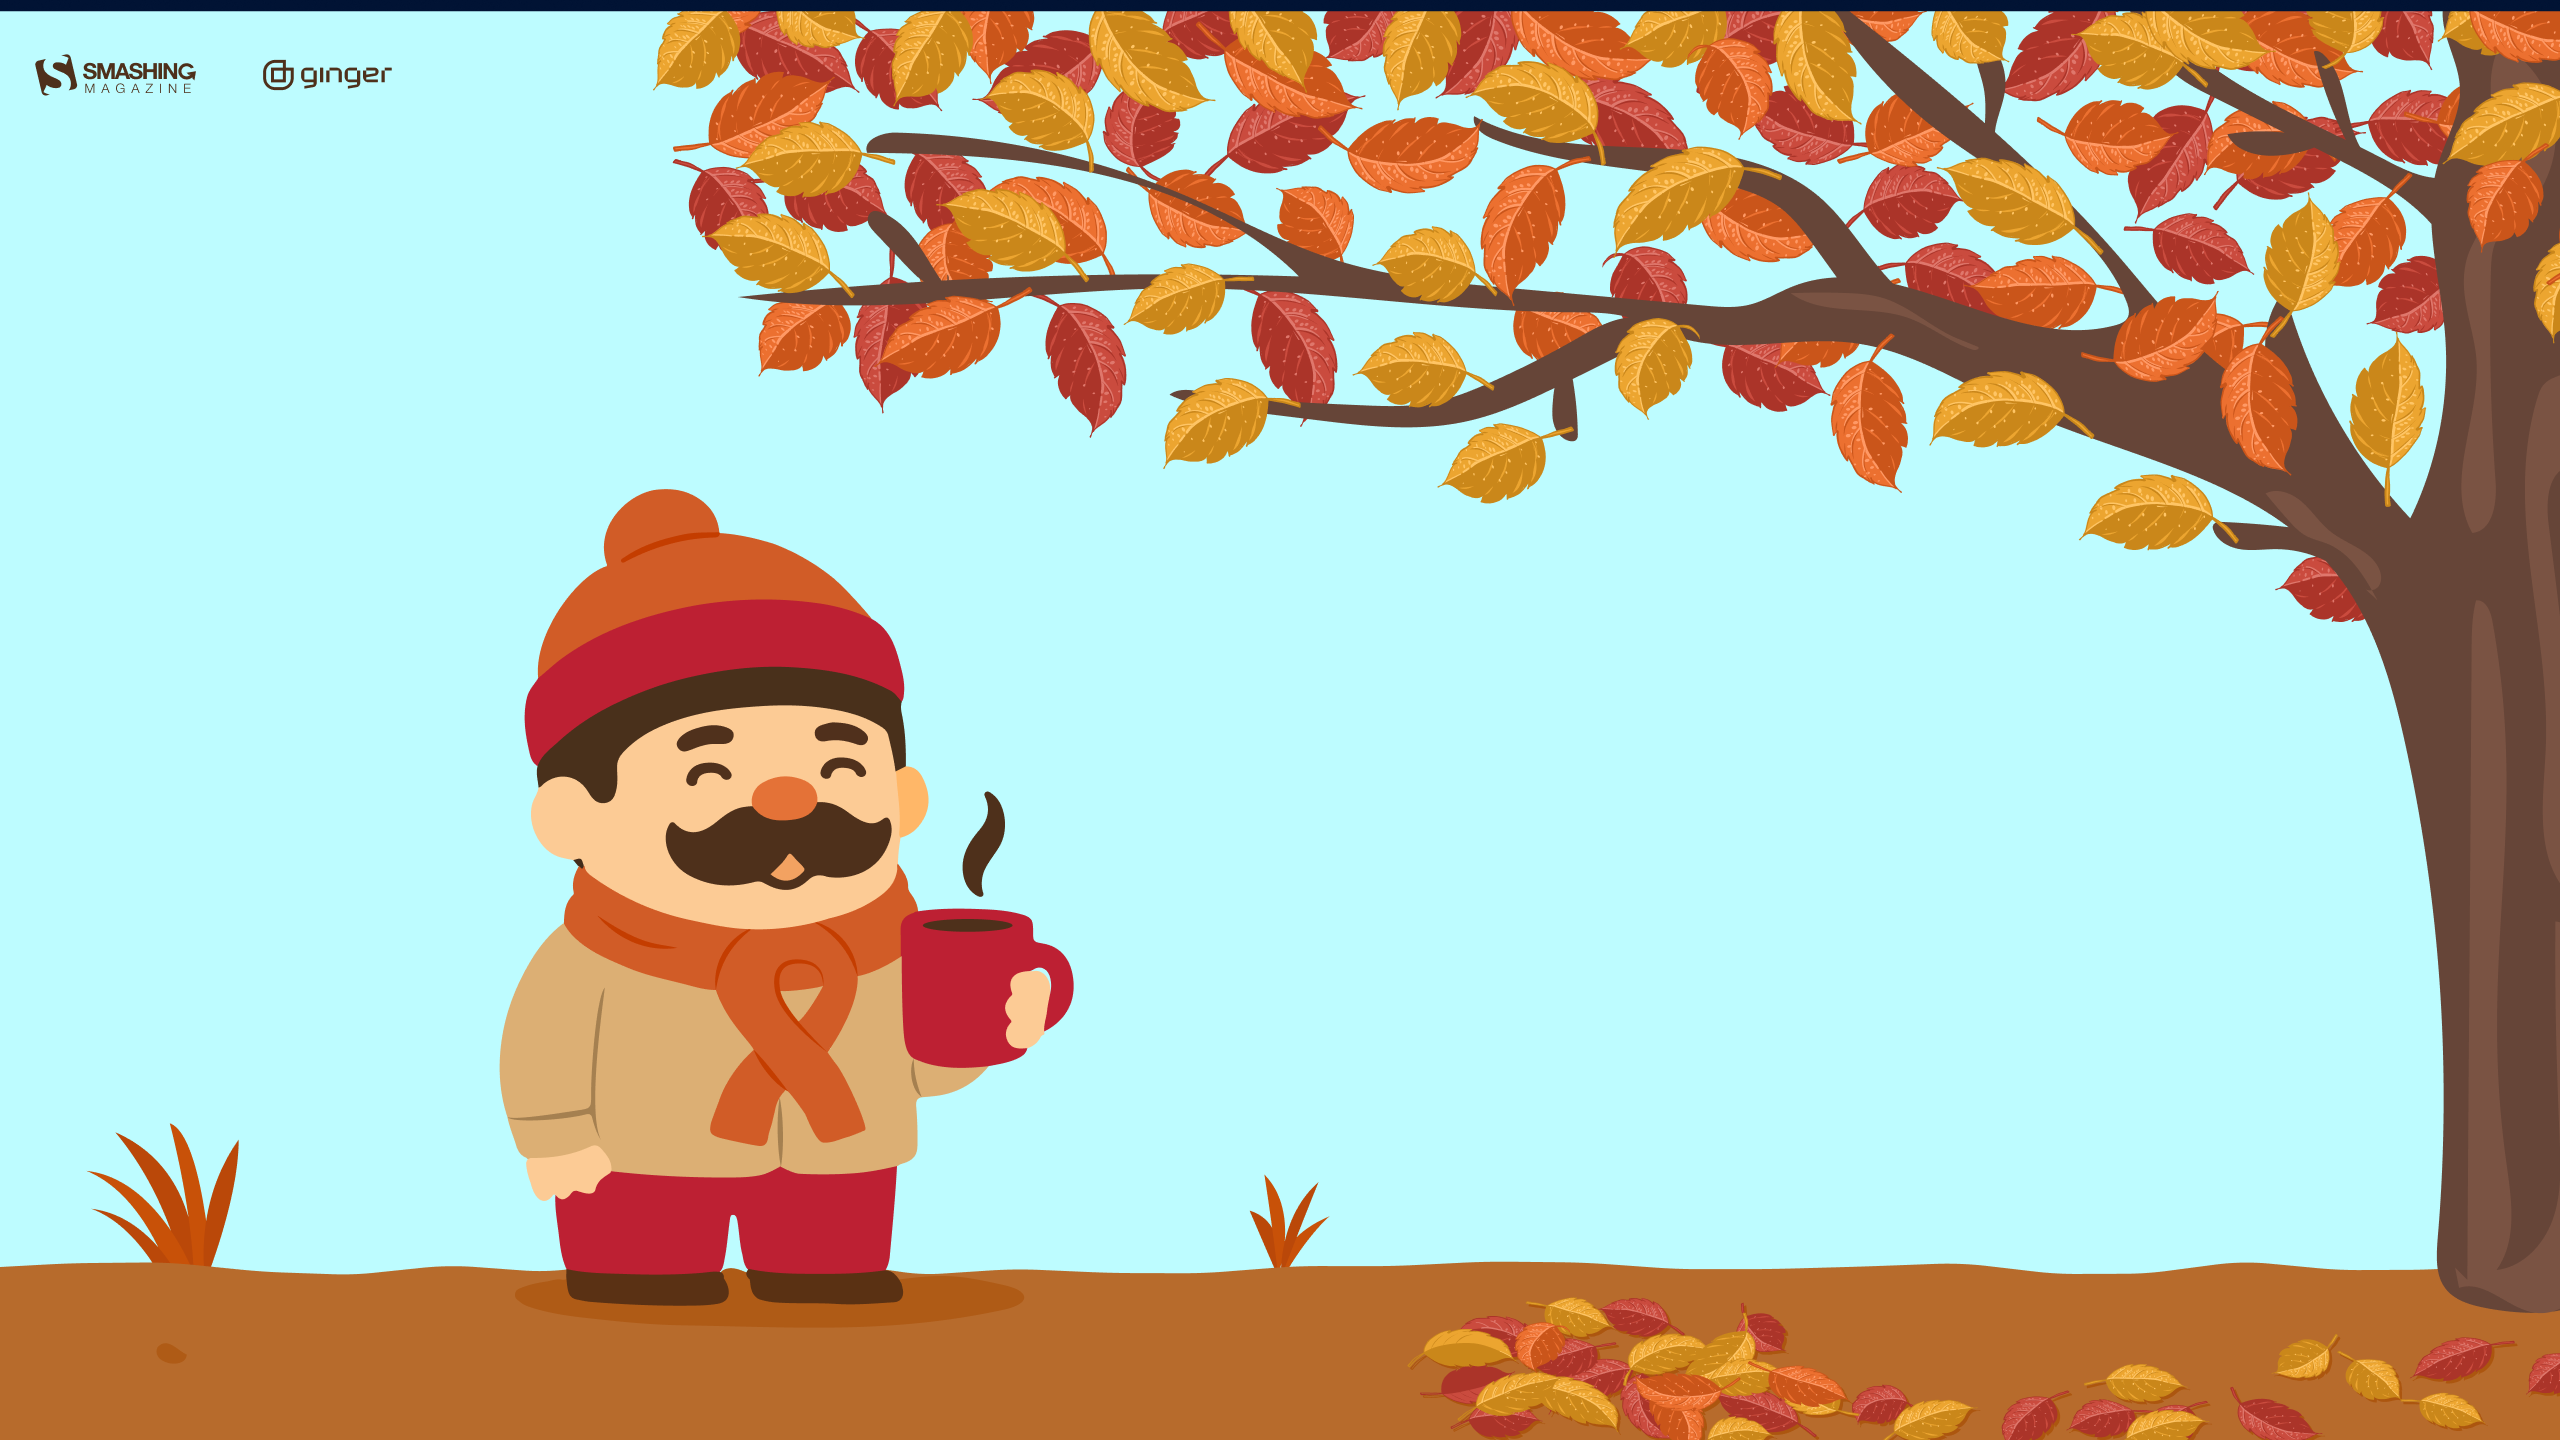
Designed by Libra Fire from Serbia.

- preview
- without calendar: 320x480, 640x480, 800x480, 800x600, 1024x768, 1024x1024, 1152x864, 1280x720, 1280x800, 1280x960, 1280x1024, 1400x1050, 1440x900, 1600x1200, 1680x1050, 1680x1200, 1920x1080, 1920x1200, 1920x1440, 2560x1440





















“‘I’m so glad I live in a world where there are Octobers.’ (L.M. Montgomery, Anne of Green Gables)” — Designed by Lívi Lénárt from Hungary.

- preview
- without calendar: 320x480, 640x480, 1024x768, 1024x1024, 1280x1024, 1400x1050, 1680x1200, 1920x1080, 1920x1200, 2560x1440



Designed by Vlad Gerasimov from Georgia.

- preview
- without calendar: 800x480, 800x600, 1024x600, 1024x768, 1152x864, 1280x720, 1280x800, 1280x960, 1280x1024, 1366x768, 1440x900, 1440x960, 1400x1050, 1600x900, 1600x1200, 1680x1050, 1680x1200, 1920x1080, 1920x1200, 1920x1440, 2560x1440, 2560x1600, 2880x1800, 3072x1920, 3840x2160, 5120x2880



“When I was young, I had a bird’s nest not so far from my room window. I watched the birds almost every day, because those swallows always left their nests in October. As a child, I dreamt that they all flew together to a nicer place, where they were not so cold.” — Designed by Eline Claeys from Belgium.

- preview
- without calendar: 1280x1024, 1440x900, 1600x1200, 1680x1050, 1680x1200, 1920x1080, 1920x1200, 1920x1440, 2560x1440



“If my heart were a season, it would be autumn.” — Designed by Lívia Lénárt from Hungary.

- preview
- without calendar: 320x480, 1024x1024, 1280x1024, 1600x1200, 1680x1200, 1920x1080, 1920x1200, 1920x1440, 2560x1440, 3840x2160











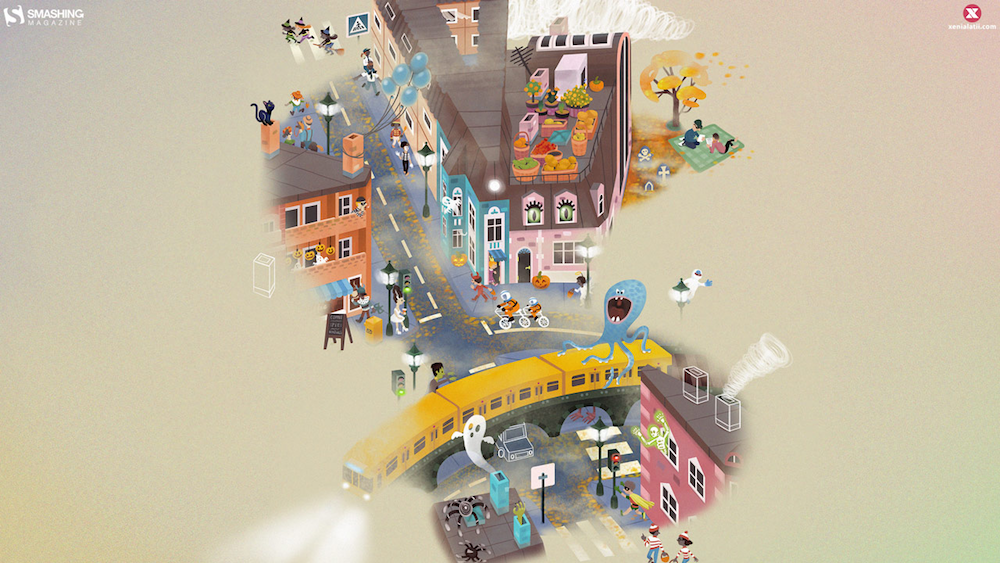
Designed by Xenia Latii from Germany.
- preview
- without calendar: 320x480, 640x480, 800x480, 800x600, 1024x768, 1152x864, 1280x720, 1280x800, 1280x960, 1280x1024, 1366x768, 1400x1050, 1440x900, 1600x1200, 1680x1050, 1680x1200, 1920x1080, 1920x1200, 1920x1440, 2560x1440


“The term ‘Hanlu’ literally translates as ‘Cold Dew.’ The cold dew brings brisk mornings and evenings. Eventually the briskness will turn cold, as winter is coming soon. And chrysanthemum is the iconic flower of Cold Dew.” — Designed by Hong, ZI-Qing from Taiwan.

- preview
- without calendar: 640x480, 800x600, 1024x768, 1080x1920, 1152x864, 1280x720, 1280x960, 1366x768, 1400x1050, 1600x1200, 1920x1080, 1920x1440, 2560x1440



Designed by Ricardo Gimenes from Spain.
- preview
- without calendar: 320x480, 640x480, 800x480, 800x600, 1024x768, 1024x1024, 1152x864, 1280x720, 1280x800, 1280x960, 1280x1024, 1366x768, 1400x1050, 1440x900, 1600x1200, 1680x1050, 1680x1200, 1920x1080, 1920x1200, 1920x1440, 2560x1440


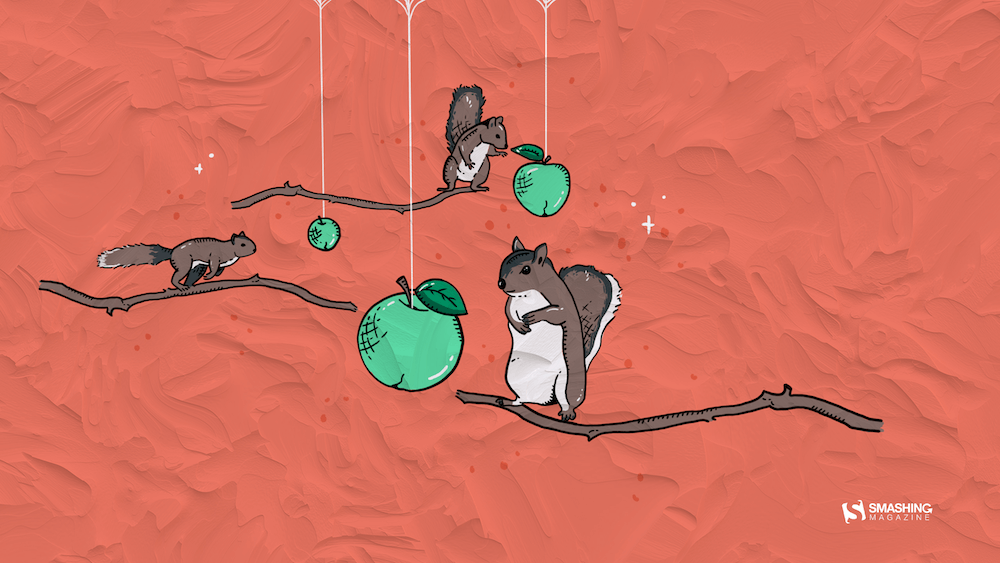
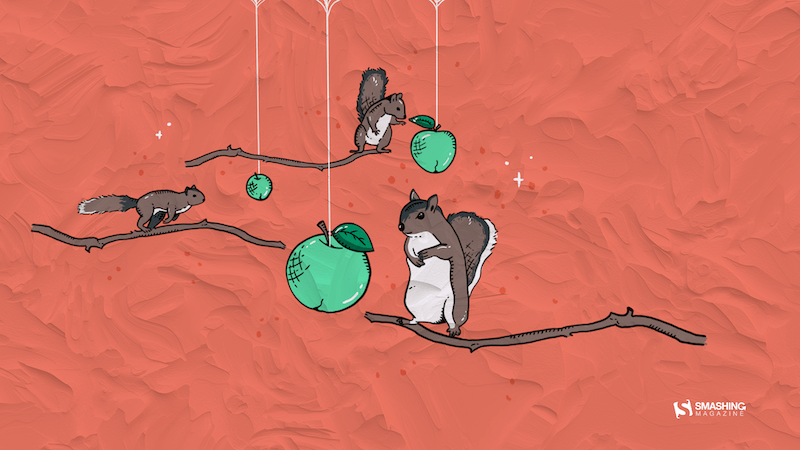
“Did you know that squirrels don’t just eat nuts? They really like to eat fruit, too. Since apples are the seasonal fruit of October, I decided to combine both things into a beautiful image.” — Designed by Erin Troch from Belgium.
- preview
- without calendar: 320x480, 800x480, 1024x1024, 1280x800, 1366x768, 1600x1200, 1680x1050, 1680x1200, 1920x1440, 2560x1440


“To me, October is a transitional month. We gradually slide from summer to autumn. That’s why I chose to use a lot of gradients. I also wanted to work with simple shapes, because I think of October as the ‘back to nature/back to basics month’.” — Designed by Jelle Denturck from Belgium.

- preview
- without calendar: 1600x1200, 1680x1050, 1680x1200, 1920x1080, 1920x1200, 1920x1440, 2560x1440, 2880x1800



Designed by Ricardo Gimenes from Spain.

- preview
- without calendar: 640x480, 800x480, 800x600, 1024x768, 1024x1024, 1152x864, 1280x720, 1280x800, 1280x960, 1280x1024, 1366x768, 1400x1050, 1440x900, 1600x1200, 1680x1050, 1680x1200, 1920x1080, 1920x1200, 1920x1440, 2560x1440, 3840x2160






















“When I was little, my parents always took me and my sister for a walk at the beach in Nieuwpoort. We didn't really do those beach walks in the summer but always when the sky started to turn gray and the days became colder. My sister and I always took out our warmest scarfs and played in the sand while my parents walked behind us. I really loved those Saturday or Sunday mornings where we were all together. I think October (when it’s not raining) is the perfect month to go to the beach for ‘uitwaaien’ (to blow out), to walk in the wind and take a break and clear your head, relieve the stress or forget one’s problems.” — Designed by Gwen Bogaert from Belgium.
Shades Of Gold



“We are about to experience the magical imagery of nature, with all the yellows, ochers, oranges, and reds coming our way this fall. With all the subtle sunrises and the burning sunsets before us, we feel so joyful that we are going to shout it out to the world from the top of the mountains.” — Designed by PopArt Studio from Serbia.

- preview
- without calendar: 320x480, 640x480, 800x480, 800x600, 1024x768, 1024x1024, 1152x864, 1280x720, 1280x800, 1280x960, 1280x1024, 1366x768, 1400x1050, 1440x900, 1600x1200, 1680x1050, 1680x1200, 1920x1080, 1920x1200, 1920x1440, 2560x1440



“As it gets colder outside, all I want to do is stay inside with a big pot of tea, eat cookies, and read or watch a movie, wrapped in a blanket. Is it just me?” — Designed by Miruna Sfia from Romania.

- preview
- without calendar: 320x480, 640x480, 800x480, 800x600, 1024x768, 1024x1024, 1152x864, 1280x720, 1280x800, 1280x960, 1280x1024, 1440x900, 1440x1050, 1600x1200, 1680x1050, 1680x1200, 1920x1080, 1920x1200, 1920x1440, 2560x1440



Designed by Amy Hamilton from Canada.

- preview
- without calendar: 1024x768, 1280x720, 1280x800, 1280x960, 1280x1024, 1400x1050, 1440x900, 1600x1200, 1680x1050, 1920x1080, 1920x1200, 2048x1536, 2560x1440, 2880x1800



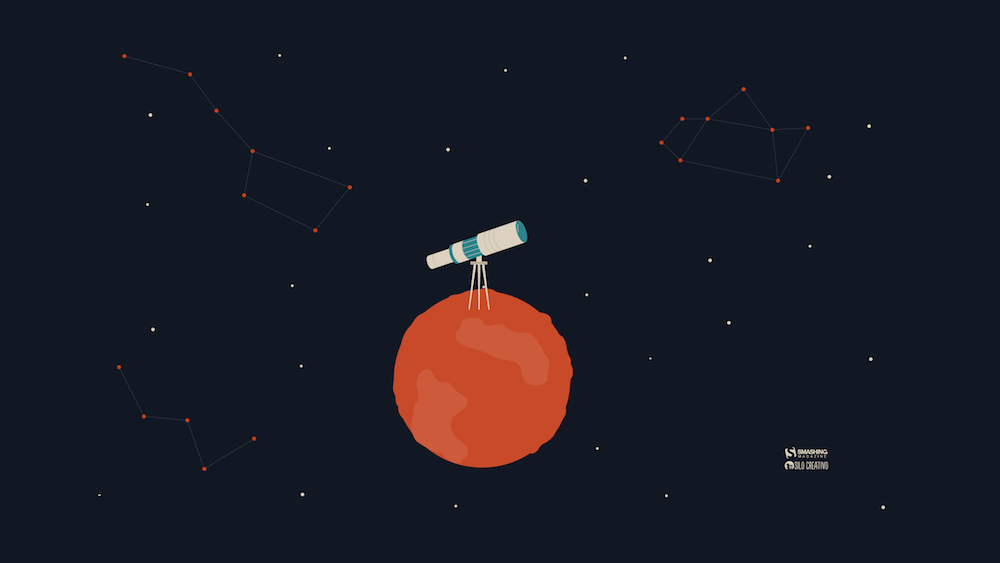
“Autumn is the best moment for discovering the universe. I am looking for a new galaxy or maybe… a UFO!” — Designed by Verónica Valenzuela from Spain.
- preview
- without calendar: 800x480, 1024x768, 1152x864, 1280x800, 1280x960, 1440x900, 1680x1200, 1920x1080, 2560x1440
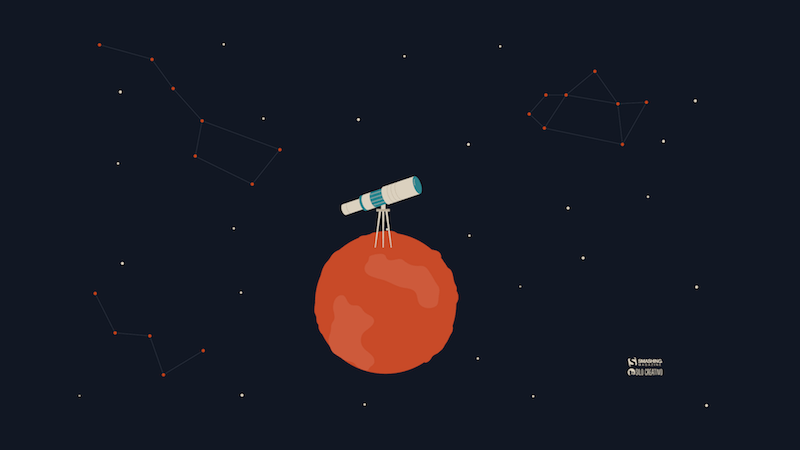


Designed by Ricardo Gimenes from Spain.

- preview
- without calendar: 640x480, 800x480, 800x600, 1024x768, 1024x1024, 1152x864, 1280x720, 1280x960, 1280x1024, 1366x768, 1400x1050, 1440x900, 1600x1200, 1680x1050, 1920x1080, 1920x1200, 1920x1440, 2560x1440, 3840x2160




















“Autumn is a wonderful time to go for walks in the forest!” — Designed by Hilda Rytteke from Sweden.
Autumn Gate



“The days are colder, but the colors are warmer, and with every step we go further, new earthly architecture reveals itself, making the best of winters’ dawn.” — Designed by Ana Masnikosa from Belgrade, Serbia.

- preview
- without calendar: 320x480, 640x480, 800x480, 800x600, 1024x768, 1024x1024, 1152x864, 1280x720, 1280x800, 1280x960, 1280x1024, 1400x1050, 1440x900, 1600x1200, 1680x1050, 1680x1200, 1920x1080, 1920x1200, 1920x1440, 2560x1440



“To me, October is all about cozy evenings with hot chocolate, freshly baked cookies, and a game night with friends or family.” — Designed by Lieselot Geirnaert from Belgium.
A Very Pug-o-ween



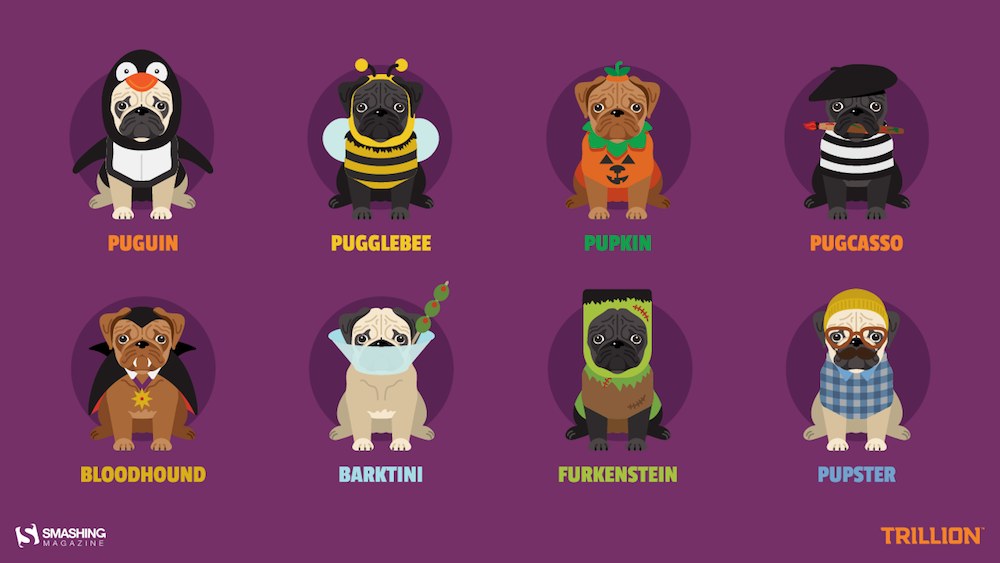
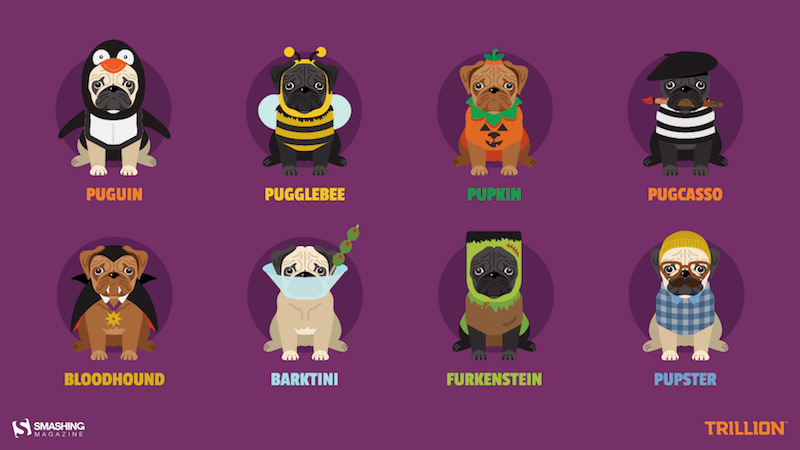
“The best part of October is undoubtedly Halloween. And the best part of Halloween is dog owners who never pass up an o-paw-tunity to dress up their pups as something a-dog-able. Why design pugs specifically in costumes? Because no matter how you look at it, pugs are cute in whatever costume you put them in for trick or treating. There’s something about their wrinkly snorting snoots that makes us giggle, and we hope our backgrounds make you smile all month.” — Designed by Trillion from Summit, NJ.
- preview
- without calendar: 1024x768, 1280x720, 1280x800, 1280x1024, 1366x768, 1440x900, 1680x1050, 1920x1080, 1920x1200, 2560x1440


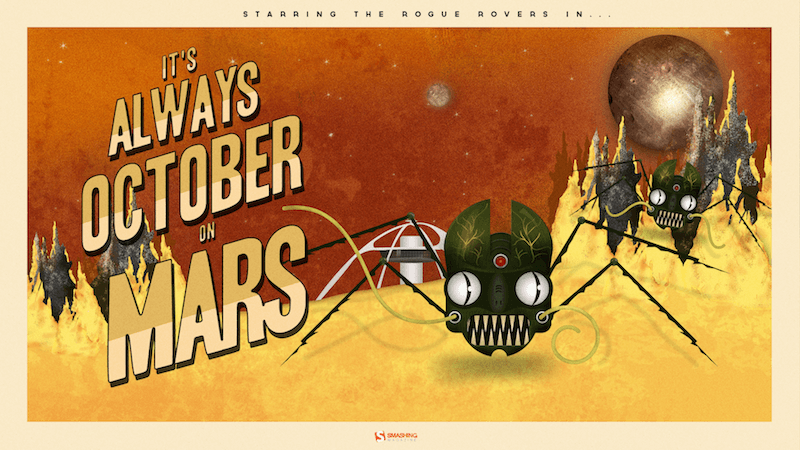
“The story is a mash-up of retro science fiction and zombie infection. What would happen if a Mars rover came into contact with an unknown Martian material and got infected with a virus? What if it reversed its intended purpose of research and exploration? Instead choosing a life of chaos and evil. What if they all ran rogue on Mars? Would humans ever dare to voyage to the red planet?” Designed by Frank Candamil from the United States.
Halloween 2040


Designed by Ricardo Gimenes from Spain.

- preview
- without calendar: 640x480, 800x600, 1024x768, 1024x1024, 1152x864, 1280x720, 1280x800, 1280x960, 1280x1024, 1366x768, 1400x1050, 1440x900, 1600x1200, 1680x1050, 1680x1200, 1920x1080, 1920x1200, 1920x1440, 2560x1440, 3840x2160





















“October is the month when the weather in Poland starts to get colder, and it gets very rainy, too. You can’t always spend your free time outside, so it’s the perfect opportunity to get some hot coffee and work on your next cool web project!” — Designed by Robert Brodziak from Poland.

- preview
- without calendar: 1024x768, 1024x1024, 1152x864, 1280x720, 1280x800, 1280x960, 1280x1024, 1400x1050, 1440x900, 1600x1200, 1680x1050, 1680x1200, 1920x1080, 1920x1200, 1920x1440, 2560x1440



“Fall is my favorite season!” — Designed by Thuy Truong from the United States.

- preview
- without calendar: 320x480, 640x480, 800x600, 1024x768, 1152x864, 1280x720, 1280x800, 1366x768, 1440x900, 1680x1050, 1680x1200, 1920x1080, 1920x1200, 1920x1440, 2560x1440



Feeling inspired? We’ll publish the November wallpapers on October 31, so if you’d like to be part of the collection, please don’t hesitate to submit your design. We are already looking forward to it!
Stop Treating CSS Container Queries Like Traditional Media Queries
To be completely honest with you, I missed the news when CSS Container Queries first shipped. And when I finally heard about it, my very first thought was, “Why exactly do I need this when media queries already exist?”
I’m not proud of that reaction, knowing what I know now, but it was comforting to know that I wasn’t alone. In fact, there are legions of us out there.
What baffles me is that container queries aren’t a new feature, as it currently sits at around 94% browser support. And yet, very few people are actually using it. According to the State of CSS survey, 86% of developers are aware of container queries, but only 41.4% actually use them. Surveys can be biased and not completely representative of our entire field, but this one is certainly the best indicator we’ve got.
Kevin Powell also talked about this at SmashingConf Amsterdam 2026: Container Queries adoption has been terrible. And that is so strange to me, knowing that the ability for components to adapt to the size of their outer container has been at the top of so many CSS wishlists over the years.
I’m not particularly interested in how many people are using container queries as much as in how they are using them. I can’t account for everyone, but from what I’ve seen — including in my own early attempts — many of us are using them wrong.
The bottom line is that incorrect use comes down to the same impression I had when learning about them: they absolutely look just like media queries at first glance. And since they look similar, it’s easy to assume they serve similar purposes and work the same way.
They don’t.
Note: I should state up front that what I’m focusing on in this article is using container size queries, i.e., a responsive design technique for responding to the size of a particular container. There are also container style queries that respond to a container’s computed styles (and are experimental at the time of this writing). You can catch up on those in Juan Diego’s piece here on Smashing Magazine where he examines their possible use cases.
Media Queries Look OutwardThe viewport is a proxy. It always has been. Media queries are what gave us the illusion that screen width alone is responsible for how responsive apps adapt to their environment.
Ask yourself this: When you write @media, what are you asking the browser?
@media (min-width: 1024px) { .card { display: flex; }I, like most developers, am asking the browser: How wide is the screen right now? That’s it.
Media queries answer that beautifully, but what happens when this .card component is placed in a grid cell that’s 300px wide on a 1920px desktop screen?
The media query doesn’t care; it does its job. The viewport is still 1920px, so min-width: 1024px fires and the matched query styles are applied, even though the card only has 300px of space to work with. Eventually, everything in the card deforms, overflows, or cramps up.
“Media queries are dumb. Not dumb in terms of the concept, but dumb in that they don’t know very much. In fact, most people assume that they know more than they do.”— Kevin Powell
It’s common to think of responsive design purely as a system for updating complete page layouts, like going from two columns on a large screen to a single column on a small screen.
Container Queries Look InwardContainer queries are smarter than that. They make responsive layouts more reliant on what’s happening inside a component rather than on the outer context that has no insight into a component’s contents. It is more like: “How much space is available for me in this specific spot, right now?”
Here is the same card code example we looked at in the last section, but with a container query:
.card-wrapper { container-name: card; container-type: inline-size; } @container card (min-width: 450px) { .card { display: flex; flex-direction: row; } }This changes everything. The card isn’t influenced by the viewport; its only concern is whether the .card component’s parent wrapper has at least 450px of inline (i.e., horizontal in a left-to-right writing mode) space. If that condition is true, the component goes horizontal; if not, it goes to its default block display.
The logic works like this:
- When there’s enough room, both items (.flex-item) sit side-by-side, each exactly half the parent container’s width.
- When there is limited space, the second item wraps to the next line.
- Because flex-grow is active on each item, the wrapped items stretch to fill most of the parent’s width.
- If the item is a container itself, it detects the sudden width expansion and fires.
This works. As the parent size shrinks and the cards wrap to two lines, the card item expands, the container query fires, and applies the necessary styles.
ConclusionAt the end of the day, the core reason why container queries look incredibly similar to media queries is simply familiarity. They’re not exactly “new”, but they are way less understood and adopted than media queries. But media queries have plenty of their own limitations; otherwise, we wouldn’t need container queries to fill those gaps.
What we have is a more effective feature for detecting when a specific component’s context changes and a means for adjusting styles based on its content, as it should be when that component can exist in multiple contexts.
Building A UX ROI Case That Survives The Boardroom
Sooner or later, a CFO looks at your wireframes and asks what any of it actually does for the bottom line. Storyboards don’t answer that question, and the era when a 5-minute pitch could answer it ended, unfortunately, a while ago.
These days, if you want to win budget, buy-in, and backing for UX, the design has to be provably good for the business, not only for the people using it.
And proving that takes more than taping a dollar sign to a redesign. You have to understand how your organization defines value in the first place, how it measures that value, and how a credible line gets drawn between a design initiative and an outcome leadership already cares about.
Rather than scatter tips, this article follows one worked example the whole way through. Meridian is a mid-size B2B SaaS company, and it is entirely made up — that label matters, so it gets repeated where it counts. Its onboarding redesign carries the same figures from goal-setting through cost accounting, causal testing, and the final ROI number, because a framework only becomes tangible when the numbers connect. Every step is one you can rerun inside your own organization.
Why ROI Matters More Than Ever in UX ConversationsCompanies now want clarity on what every dollar buys, and “delightful user experiences” stopped clearing that bar some time ago. I still remember a former colleague celebrating a $1 million redesign he’d gotten greenlit mostly on the strength of a couple of three.js tricks. Try that pitch in front of a finance team today and see how far the particles get you.
Executives don’t hate UX, they just hate vagueness. A pitch built on “users will find it easier” loses, every time, to the department promising 12% more sales in Q3. The difference is the one between a streamlined checkout flow that reduced cart abandonment with completed purchases up 22%, and the same work rewarded with “the QA testers like it.” One of those goes on your resume. The rest of this article is about earning the first version, with Meridian’s numbers doing the work.
When Business Goals And KPIs Don’t Exist YetMost writing about UX ROI makes a convenient assumption: that the organization already owns clean business goals and KPIs for you to hook your work onto. Real companies are messier than that. Plenty run on ambitions like “grow faster” or “improve the customer journey” that nobody ever broke into anything measurable, and an ROI case built on that ambiguity sounds impressive right up until somebody scrutinizes it.
So the first job is often to help the organization define what success even looks like. Interview stakeholders across departments — what does product consider a good quarter, where does customer success watch users struggle, where do sales deals stall — and listen for the themes that keep resurfacing across conversations, because those recurring themes are the company’s latent business objectives. A useful forcing function is the OKR model (Objectives and Key Results), which doesn’t tolerate vagueness.
At Meridian, the stated ambition was “improve the rate of new users’ adoption of the platform,” which you can neither design toward nor measure against. Interviews turned up the real shape of the problem. Trial users needed a median of 14 days to reach first value, most churned before getting there, and onboarding questions were burying the support queue. Out of that came an OKR with actual edges: reduce median time-to-first-value from 14 days to 7 with the use of a guided setup flow, and lift trial-to-paid conversion from 8% to 9.5%.
One warning about formalizing KPIs: Impose them from inside the UX team and leadership will suspect you’ve rigged the field in your own favor, so co-create them with whoever owns the outcome — though never at the price of accepting targets that set your team up for an uncomfortable situation. Meridian’s head of product agreed that setup-completion rate was a fair proxy for onboarding usability, and customer success signed off on time-to-first-value, a number already sitting on their own dashboard.
A KPI ladder that ends at a metric somebody already watches buys you credibility before any design work starts. Quantifying The Full Cost Of The InvestmentROI has a denominator, and the denominator is where most UX teams go wrong. You can’t calculate a return without strategic financial planning, yet cost usually gets counted as designer salaries or consulting hours and nothing else. A finance team will find the rest whether or not you counted it, so count it first.
Direct costs are the visible ones. Meridian’s redesign ran $45,000 in design and research labor plus another $8,000 in tooling and participant incentives. Licenses for Figma, UserTesting, Hotjar, analytics platforms, research incentive spend — all of it belongs in the total, and that’s before the inevitable instances of vendor lock-in every UX team eventually faces. Engineering sits in the same column, because a UX redesign doesn’t stop at the mockup. Building the guided setup took two frontend sprints plus a QA pass, $38,000 worth, and the project generated about $4,000 of coordination overhead along the way in new syncs and shared dashboards.
The line item nearly everyone misses, and the one worth stealing from this article if you steal nothing else, is stakeholder time. Workshops, design reviews, and feedback sessions all pull senior people away from their primary work. A VP of Product spending four hours a week in UX reviews is a VP not spending those hours on roadmap planning or partner negotiations. Log the attendance — who came, for how long, at what seniority — and price it at fully loaded cost, meaning salary plus benefits divided by productive hours. A quarter’s worth of workshops, reviews, and interviews at Meridian priced out at $22,000.
Add it all up: $45,000 in design labor, $8,000 in tooling, $38,000 in engineering, $22,000 in stakeholder time, $4,000 in coordination. The investment is $117,000. Saying that number out loud beats saying “we spent $45K on design,” precisely because it already includes everything a finance team would have dug up on its own.
Proving Causation, Not Just CorrelationMost UX ROI pitches die right here. Conversions rose after the redesign, sure — and the CFO wants to know how you ruled out the new pricing, the seasonal traffic bump, and the marketing campaign that shipped the same week. Without a convincing answer, your entire ROI story crumbles.
After all these years, the gold standard for proving causation is still A/B testing: run the old experience against the new one on an even traffic split until the sample means something.
Onboarding happens to suit a phased rollout, which is why Meridian could do this cleanly. For eight weeks, half of new trial signups received the redesigned guided setup while half stayed on the legacy flow. Control converted to paid at 8.0%. The variant came in at 9.4%. With roughly 6,100 trials inside the window, the difference was statistically significant, but a 1.4-point gap on a single test is still the kind of result that deserves a second look before anyone builds a budget on it, which is one reason the team held back on attribution below. Where a split isn’t feasible — a change too structural, a user base too small — fall back to a time series instead. Measure steadily for weeks before the change, implement, then keep measuring against the baseline you established.
Documenting whatever else happens around the same time as your UX change is the unglamorous half of causation.
A pricing-page test from Meridian’s marketing team overlapped weeks five through eight of the rollout. The UX team noted it, confirmed it hit both cohorts evenly, and still chose to attribute only 70% of the observed lift to the redesign in the final math. There is no formula that produces that number; treat it as an illustrative assumption for this example.
The team asked how much of the lift could plausibly belong to the pricing test if it had helped one cohort slightly more than the other, settled on a ceiling of about a third, and rounded the redesign’s share down to 70%. Your figure will differ. What matters is that it is written down and argued for before the results arrive, not fitted to them afterwards. That restraint is worth money in a skeptical room. “We attribute roughly 70% of the lift to the onboarding change, with the remainder likely influenced by concurrent pricing work” survives cross-examination; claiming everything does not. Cohort analysis then backed the number up, since the lift held across acquisition channels and tenure bands, and at that point the skeptics had very little left to work with.
Leading and lagging indicators belong on the same slide, because each covers the other’s weakness. Meridian’s leading indicators moved first — setup completion climbed from 62% to 89%, median time-to-first-value dropped from 14 days to 6.5 — and the lagging trial-to-paid number followed. Mechanism first, business outcome second. Presented together, they form a causal chain that’s harder to poke holes in than either one alone.
The ROI Calculation, End to EndSo what did Meridian actually earn? The company sees about 40,000 trial signups a year. Lifting conversion from 8.0% to 9.4% adds roughly 560 paying customers annually, and at an average of $1,800 in annual recurring revenue per account, those customers represent about $1,008,000 in new ARR. Applying the conservative 70% attribution from the causal work trims the defensible figure to roughly $706,000.
Set that against the full $117,000 investment and the first-year ROI lands near 5:1, with payback arriving in roughly two months. There’s a second line, too. Onboarding-related support tickets dropped about 30%, some 3,600 fewer tickets a year, worth another $54,000 annually at $15 per resolved ticket. Keep it as its own line rather than folding it into one swollen headline number. The case reads as more honest that way and loses none of its force.
Three assumptions carry that result, and each belongs on the slide next to it. The 40,000 signups and the $1,800 average ARR are the prior year’s actuals held flat, so a growth or pricing change moves the outcome in either direction. The 70% attribution is the illustrative assumption from the causal work, not a measured quantity. And the two-month payback counts new ARR as it lands rather than revenue recognized net of churn, which flatters the timeline; on a net basis the payback stretches to roughly a quarter. State those three plainly and a finance team can adapt the example to its own numbers. Hide them and the whole thing starts to look like marketing math, however careful the experiment was.
What persuades in the final presentation is not sophistication. Open with the baseline: what stalled trials and support volume were already costing. Show the delta in terms leadership reads fluently, metrics like conversion rate uplift chief among them. A chart of setup completion climbing from 62% to 89% will beat a paragraph of UX jargon, and a translation like “each abandoned setup costs us 0.3 support tickets” beats the chart. Above all, keep every figure identical from the first slide to the last. A room full of finance people forgives many things, but never numbers that wobble between slides.
Tailoring The Case To Whoever Holds The Purse StringsBudget decisions come out of coalitions. A CFO may hold the final say when adding AI to the checkout process, but marketing, product, and customer success all lean on that decision, and each means something different by “value.”
A CFO hears cost, revenue, and risk. A CMO hears conversion and acquisition cost, since UX is a lever for increasing marketing ROI. Product counts support tickets; customer success thinks in retention. The underlying numbers never change; only the framing rotates, and a CFO wants a projection, not a moodboard. Meridian’s CFO slide read “the onboarding redesign protects roughly $706,000 in new ARR a year against a $117,000 investment,” while the CMO version led with what a 9.4% trial conversion does to blended acquisition cost.
Beyond the Dollar Sign: Qualitative and Non-Financial MetricsSome UX outcomes never translate cleanly into revenue, and pretending they do weakens the parts of your case that are solid.
The trick with qualitative evidence is collecting it rigorously enough that nobody can wave it off as anecdote.Scores like Net Promoter Score (NPS), CSAT, and Customer Effort Score already sit inside most reporting cadences, which makes them cheap to borrow. Tie your work to their movement, and segment wherever the data allows.
Meridian could say that NPS among trial users on the redesigned onboarding was 51 against 34 for the legacy flow, which lands far harder than any blended average. Verbatim feedback from surveys, support transcripts, and app store reviews adds the emotional weight the scores lack. Internal tools deserve the same discipline, since employee experience is increasingly recognized as a business driver — a dashboard redesign that hands account managers 45 minutes a day back is a productivity gain, a satisfaction gain, and a retention lever all in one.
Brand perception resists direct measurement but leaves tracks in repeat visits, organic referrals, and social sentiment. It carries extra weight in trust-sensitive industries like finance or healthcare, and it forms fast, given that UX design influences the first impressions of a whopping 94% of customers.
Whatever you collect, systematize the collecting. Run pre- and post-surveys with consistent question sets, use structured usability testing with task-based scoring, and put the qualitative right next to the quantitative when you present.
“Setup completion rose from 62% to 89%, and in post-test interviews 8 of 10 participants called the new flow intuitive, against 3 of 10 for the old one” — a pairing like that is much harder to dismiss than either half on its own. Making the Case StickUX loses the budget battle unless it’s mapped to company-wide objectives, so phrase the proposal in the words of this year’s board presentation.
Nobody at Meridian pitched “simplify the onboarding UI”; the pitch was a redesigned trial experience worth 1.4 points of upgrade rate, roughly $1M in annual recurring revenue before attribution. Bring evidence in both registers, since that is what social proof is for: the case, clearly labeled, plus screenshots, impact graphs, and user quotes. Find internal allies who can repeat the ROI narrative in rooms you’ll never enter, and write the playbook down, because repeatable ROI is what earns recurring investment.
Resources for Going DeeperThis topic has been explored extensively by researchers, practitioners, and consultancies. Here’s a curated set of resources worth studying if you want to build a stronger ROI practice around UX.
- “Measuring the User Experience” by Tom Tullis and Bill Albert is the definitive guide to UX metrics. It covers everything from task-based measurements to survey design to statistical analysis, and it’s written for practitioners, not academics.
- Jared Spool’s “The $300 Million Button” case study is a classic example of how a single UX change (removing a mandatory registration step) generated massive revenue uplift. It’s a story every UX professional should have in their back pocket.
- Forrester’s research on UX ROI provides enterprise-focused frameworks for building business cases around experience design, including their widely cited finding that every dollar invested in UX returns $100.
- “UX Strategy” by Jaime Levy bridges the gap between design thinking and business strategy, offering practical tools for aligning UX initiatives with organizational goals and market positioning.
- The Design Value Index by the Design Management Institute tracks publicly traded companies that invest heavily in design against the S&P 500. The data consistently shows that design-led companies outperform the index by significant margins, and it’s a powerful data point for executive presentations.
- Google’s HEART framework provides a structured approach to selecting UX metrics at scale. HEART stands for Happiness, Engagement, Adoption, Retention, and Task success, and it’s particularly useful for teams that struggle to decide which metrics to track.
A seat at the table never comes from beauty or novelty. It comes from measurable, defensible impact, which means UX leaders have to trade the artist’s posture for the strategist’s. Speak in outcomes rather than outputs. Connect pixels to profit.
When someone challenges the numbers, don’t flinch. Show the controlled experiment, the cohort analysis, and the before-and-after metrics, every figure holding steady from the first slide to the last, the way Meridian’s did, with the customer quotes and the employee-satisfaction data sitting right beside the revenue impact. Prove the work does more than delight users, and be ready to defend the ratio line by line. That’s when the CFO leans in, and that’s when design stops being optional.
The Death Of The Button: Why The Best Interface Is No Interface
Ever since the commercialisation of the Graphical User Interface pioneered by systems like the Xerox Star and popularised by the original Apple Macintosh, software has relied heavily on point-and-click interactions. If you wanted to book a trip, buy a pair of shoes, or research a health symptom, you were expected to navigate a labyrinth of user interfaces. You click menus, adjust range sliders, fill out multi-step forms, deal with cookie pop-ups, and open dozens of browser tabs just to cross-reference basic information. We have become accustomed to spending more time managing the software rather than actually achieving our goals.
That contract is officially changing. Driven by advances in artificial intelligence and large language models, a new generation of web tools is pioneering a radical philosophy: Intent-Driven Design. Rather than expecting our users to learn complex menus and click through elaborate sales funnels, these platforms operate by capturing high-level human goals and silently executing the grunt work in the background.
This vision builds on long-standing HCI concepts like Golden Krishna’s “The Best Interface Is No Interface” and Don Norman’s principles of human-centered design.
The ultimate goal of modern web design is no longer to build prettier buttons or flashy animations; it is to eliminate the interface entirely.
Well, at least what we understand based on our current experience.
It is essential for UX designers to understand the changes we’re witnessing and even re-evaluate our role, shifting our focus from designing visible interfaces to guiding transparent, intent-driven AI experiences.
The Death Of The “10-click” ProcessTo understand where web design is going, we first have to look at the friction we have accepted as “normal” for decades.
Consider the traditional workflow of buying a flight online. The user experience is intentionally hyper-interactive:
- Navigate to a travel aggregator or airline website.
- Select “Round Trip” from a dropdown menu.
- Type the origin city and wait for auto-complete.
- Type the destination city and wait for auto-complete.
- Click a calendar modal, toggle through months, and select departure and return dates.
- Choose the number of passengers and cabin class.
- Click “Search” and wait for the results page to load.
- Filter by price, layover duration, departure time, and airline.
- Sort the results and scan through dozens of individual options.
- Click through a three-page checkout funnel dodging upsells for rental cars and travel insurance.
This is a classic point-and-click UI paradigm. The computer acts as a passive container of data, and the human acts as the orchestrator, manually inputting parameters, interpreting raw outputs, and executing each micro-step along the way.
Intent-driven design flips this dynamic entirely. Instead of forcing you to navigate the mechanical steps of how to find a flight, the interface asks a simple question: What are you trying to accomplish?
When you express a goal, such as “Find me a non-stop flight to Chicago next weekend under $300 that arrives before 5 PM”, the software reads your intent, executes the multi-step search query behind the scenes, compares the options, and presents a single actionable resolution. The ten clicks dissolve into one clear intent outcome.
Three Web Platform Examples Replacing Buttons With IntentThis shift isn’t a theoretical vision of the distant future. Some of the world’s most accessible websites allow you to experience intent-capturing systems already.
1. Perplexity AI: Search Without The Open TabsTraditional search engines like Google were built as directories. You typed a keyword, and the interface rewarded you with ten blue links. The actual work of opening five tabs, skimming long articles, dodging ads, and manually assembling an answer was left to you. Although this is now changing, with AI content appearing first when you search on Google.
Perplexity AI allows anyone to perform instant intent-based searches. Instead of forcing you to click into multiple tabs, the interface synthesises the perfect result for your context.
- The interaction: You ask a complex question in plain English: “Compare the top three budget laptops for a computer science student, focusing on battery life and keyboard quality.”
- The invisible work: In under two seconds, the platform searches the web, reads dozens of articles, evaluates hardware specifications, and cross-references user reviews.
- The result: (See screen above) Instead of throwing web pages at you, Perplexity dynamically generates a single custom answer complete with formatted comparison tables, pros and cons lists, and concise inline citations. You get the outcome of thirty clicks in just one.
For years, creating a website meant using visual builders like Figma or drag-and-drop web editors. As designers, we spent hours manually drawing rectangles, picking hexadecimal colour codes, adjusting padding values, and sometimes writing CSS code.
Vercel v0 lets anyone test its generative interface builder right from the home page without signing in.
- The Interaction: A user types a descriptive goal into the input prompt: “Create a modern dark-mode dashboard for a subscription SaaS app showing monthly revenue, active users, and a customer churn chart.”
- The invisible work: The underlying AI understands layout principles, accessibility guidelines, UI component libraries, and responsiveness. It writes clean HTML, Tailwind CSS, and React code in real time.
- The result: Rather than spending an afternoon manipulating elements, the user receives a fully functional, pixel-perfect user interface in seconds! The traditional visual design tool disappears, replaced by raw human intent.
Many traditional productivity tools require you to manually construct task lists, drag items across Kanban boards, and assign micro-deadlines. Goblin.tools is a free, single-page suite of single-task AI tools designed specifically for neurodivergent users or anyone feeling overwhelmed, requiring zero sign-ups or configuration.
- The interaction: You enter a vague, intimidating goal into the Magic Todo tool, such as “Prepare for a job interview”.
- The invisible work: Instead of forcing you to plan every step, the system analyses the cognitive load of the goal and automatically breaks it down into small, actionable sub-tasks adjusted to your preferred level of detail.
- The result: The interface eliminates the stressful task-planning phase and presents a clean checklist tailored to your exact goal.
When you remove traditional menus, sidebars, and forms, how do you keep a website usable? Designers pioneering this space rely on three core pillars:
Pillar Traditional UX approach Intent-driven UX approach User input Micro-actions (Clicks, dropdowns, toggles) 1. High-level goals (Natural language, context, habits) Interface state Static layouts (Everyone sees the same page) 2. Generative UI (Layouts created dynamically on the fly) Task execution Manual execution by the user 3. Autonomous execution by background AI agents 1. High-level GoalsAn invisible interface doesn’t always wait for you to type a command — it leverages context to anticipate user needs. Guided by industry standards like Apple’s Human Interface Guidelines on Contextual & Ambient Design, modern systems read environmental metadata, such as device state, location, and past interaction patterns, to trigger proactive actions.
For example:
- Time and location: A food delivery web app prioritising your saved home address and dinner items automatically at 6:30 PM on a weekday.
- Cross-app history: A calendar application noticing an email about an upcoming appointment and surfacing a one-click “Add to Schedule” card without forcing you to copy and paste event details manually.
In traditional web design, every user sees the exact same layout. An e-commerce store shows the same navigation bar whether you are a first-time visitor looking for customer support or a returning customer tracking a package.
As highlighted in the Nielsen Norman Group’s analysis on AI as a new UX paradigm, computing is shifting from command-based interaction to outcome-specification. This enables Generative UI, where interfaces are rendered dynamically on the fly based on what you are trying to do in that exact moment. For example, platforms like Vercel v0 demonstrate how raw intent can instantly render functional code components without manual layout building. If you express a desire to compute complex financial data, the interface generates a dynamic calculator widget on demand, receding once your goal is completed.
3. Execution by AI AgentsTraditional interfaces are obsessed with prevention, constantly peppering users with confirmation pop-ups (“Are you sure you want to delete this file?”).
Intent-driven interfaces adapt Jakob Nielsen’s 10 Usability Heuristics on User Control and Error Recovery by shifting the safety net from prevention to easy reversibility. Because autonomous agents take actions on your behalf, products prioritise frictionless rollback mechanisms. A prominent “Undo” button, simple revision prompts (“Make this summary shorter”), and transparent audit logs replace intrusive warning modals.
The Hidden RisksWhile removing interface friction is liberating, stripping away visual controls introduces significant product design challenges. When software acts on inferred intent rather than direct point-and-click commands, designers must navigate critical ethical and technical pitfalls.
The Illusion Of ControlWhen a website makes decisions for you, it can quickly feel patronising or invasive. As explored by the Stanford Human-Computer Interaction (HCI) Group, automation must maintain clear boundaries to prevent user frustration. Furthermore, ethical frameworks from the Center for Humane Technology emphasise that product designers must guard against manipulative defaults.
Designers must strike a delicate balance: automate routine execution, but explicitly prompt the user for high-stakes confirmations (such as financial transactions, publishing public content, or altering privacy settings).
The Black Box ProblemIn a traditional UI, if you get an unexpected result, you can usually diagnose the issue — perhaps you checked the wrong filter box or selected an incorrect date.
With an intent-driven interface, troubleshooting becomes harder. To address this “black box” challenge, the Google PAIR (People + AI Research) Guidebook advocates for transparent feedback loops. The system must explicitly state its interpretation (“Searching for non-stop flights to Chicago under $300...”) so users can calibrate trust and correct misinterpretations instantly.
From A UX PerspectiveAs a UX designer, always being curious to understand how our design approach is changing in the world of AI, I find it essential that we re-evaluate the foundational elements of our craft.
Rather than designing static buttons and rigid forms, we need to learn to map and present dynamic, generative UI components that adapt on the fly to user intent.
By mastering these evolving patterns, like ambient feedback, inline prompts, and transparent AI status indicators, we can ensure that screenless, agent-driven tools remain intuitive, ethical, and deeply human-centered.
Conclusion The ultimate goal: The best design is no design.For decades, the digital industry has evaluated software success through engagement metrics like time spent in app, click-through rates, and page views per session. Websites were deliberately engineered to maximise visual engagement and interaction volume.
The philosophy behind Golden Krishna’s seminal book The Best Interface Is No Interface, aligned with the broader Center for Humane Technology’s Time Well Spent movement, turns these metrics on their head. The ultimate test of a modern digital product is no longer how visually captivating its buttons are, but rather: How effectively did this software solve the problem and get out of the user’s way?,
We are entering an era where web applications will no longer be measured by the beauty of their interfaces, but by their ability to render those complex interfaces completely obsolete. The future of the web isn’t more interaction — it is seamless, invisible completion.
The Many Faces Of September (2026 Wallpapers Edition)
For more than 15 years already, our monthly wallpapers series has been the perfect opportunity for creatives of all backgrounds to put their skills to the test. You don’t have to meet stakeholder or client requirements; for a change, it’s just you, exploring your ideas and bringing them to life in your own, unique style. Since we first embarked on this wallpapers journey, so many talented folks from all across the globe have accepted the challenge, and this September is no exception.
Created with love by the community for the community, all the wallpapers in this collection come in a variety of screen resolutions and can be downloaded for free. A huge thank-you to everyone who tickled their creativity and shared their designs with us — this post wouldn’t be possible without your kind support!
If you’d also like to be featured in one of our upcoming wallpapers posts, please don’t hesitate to join in. We can’t wait to see your story come to life! Happy September!
- You can click on every image to see a larger preview.
- We respect and carefully consider the ideas and motivation behind each and every artist’s work. This is why we give all artists the full freedom to explore their creativity and express emotions and experience through their works. This is also why the themes of the wallpapers weren’t anyhow influenced by us but rather designed from scratch by the artists themselves.
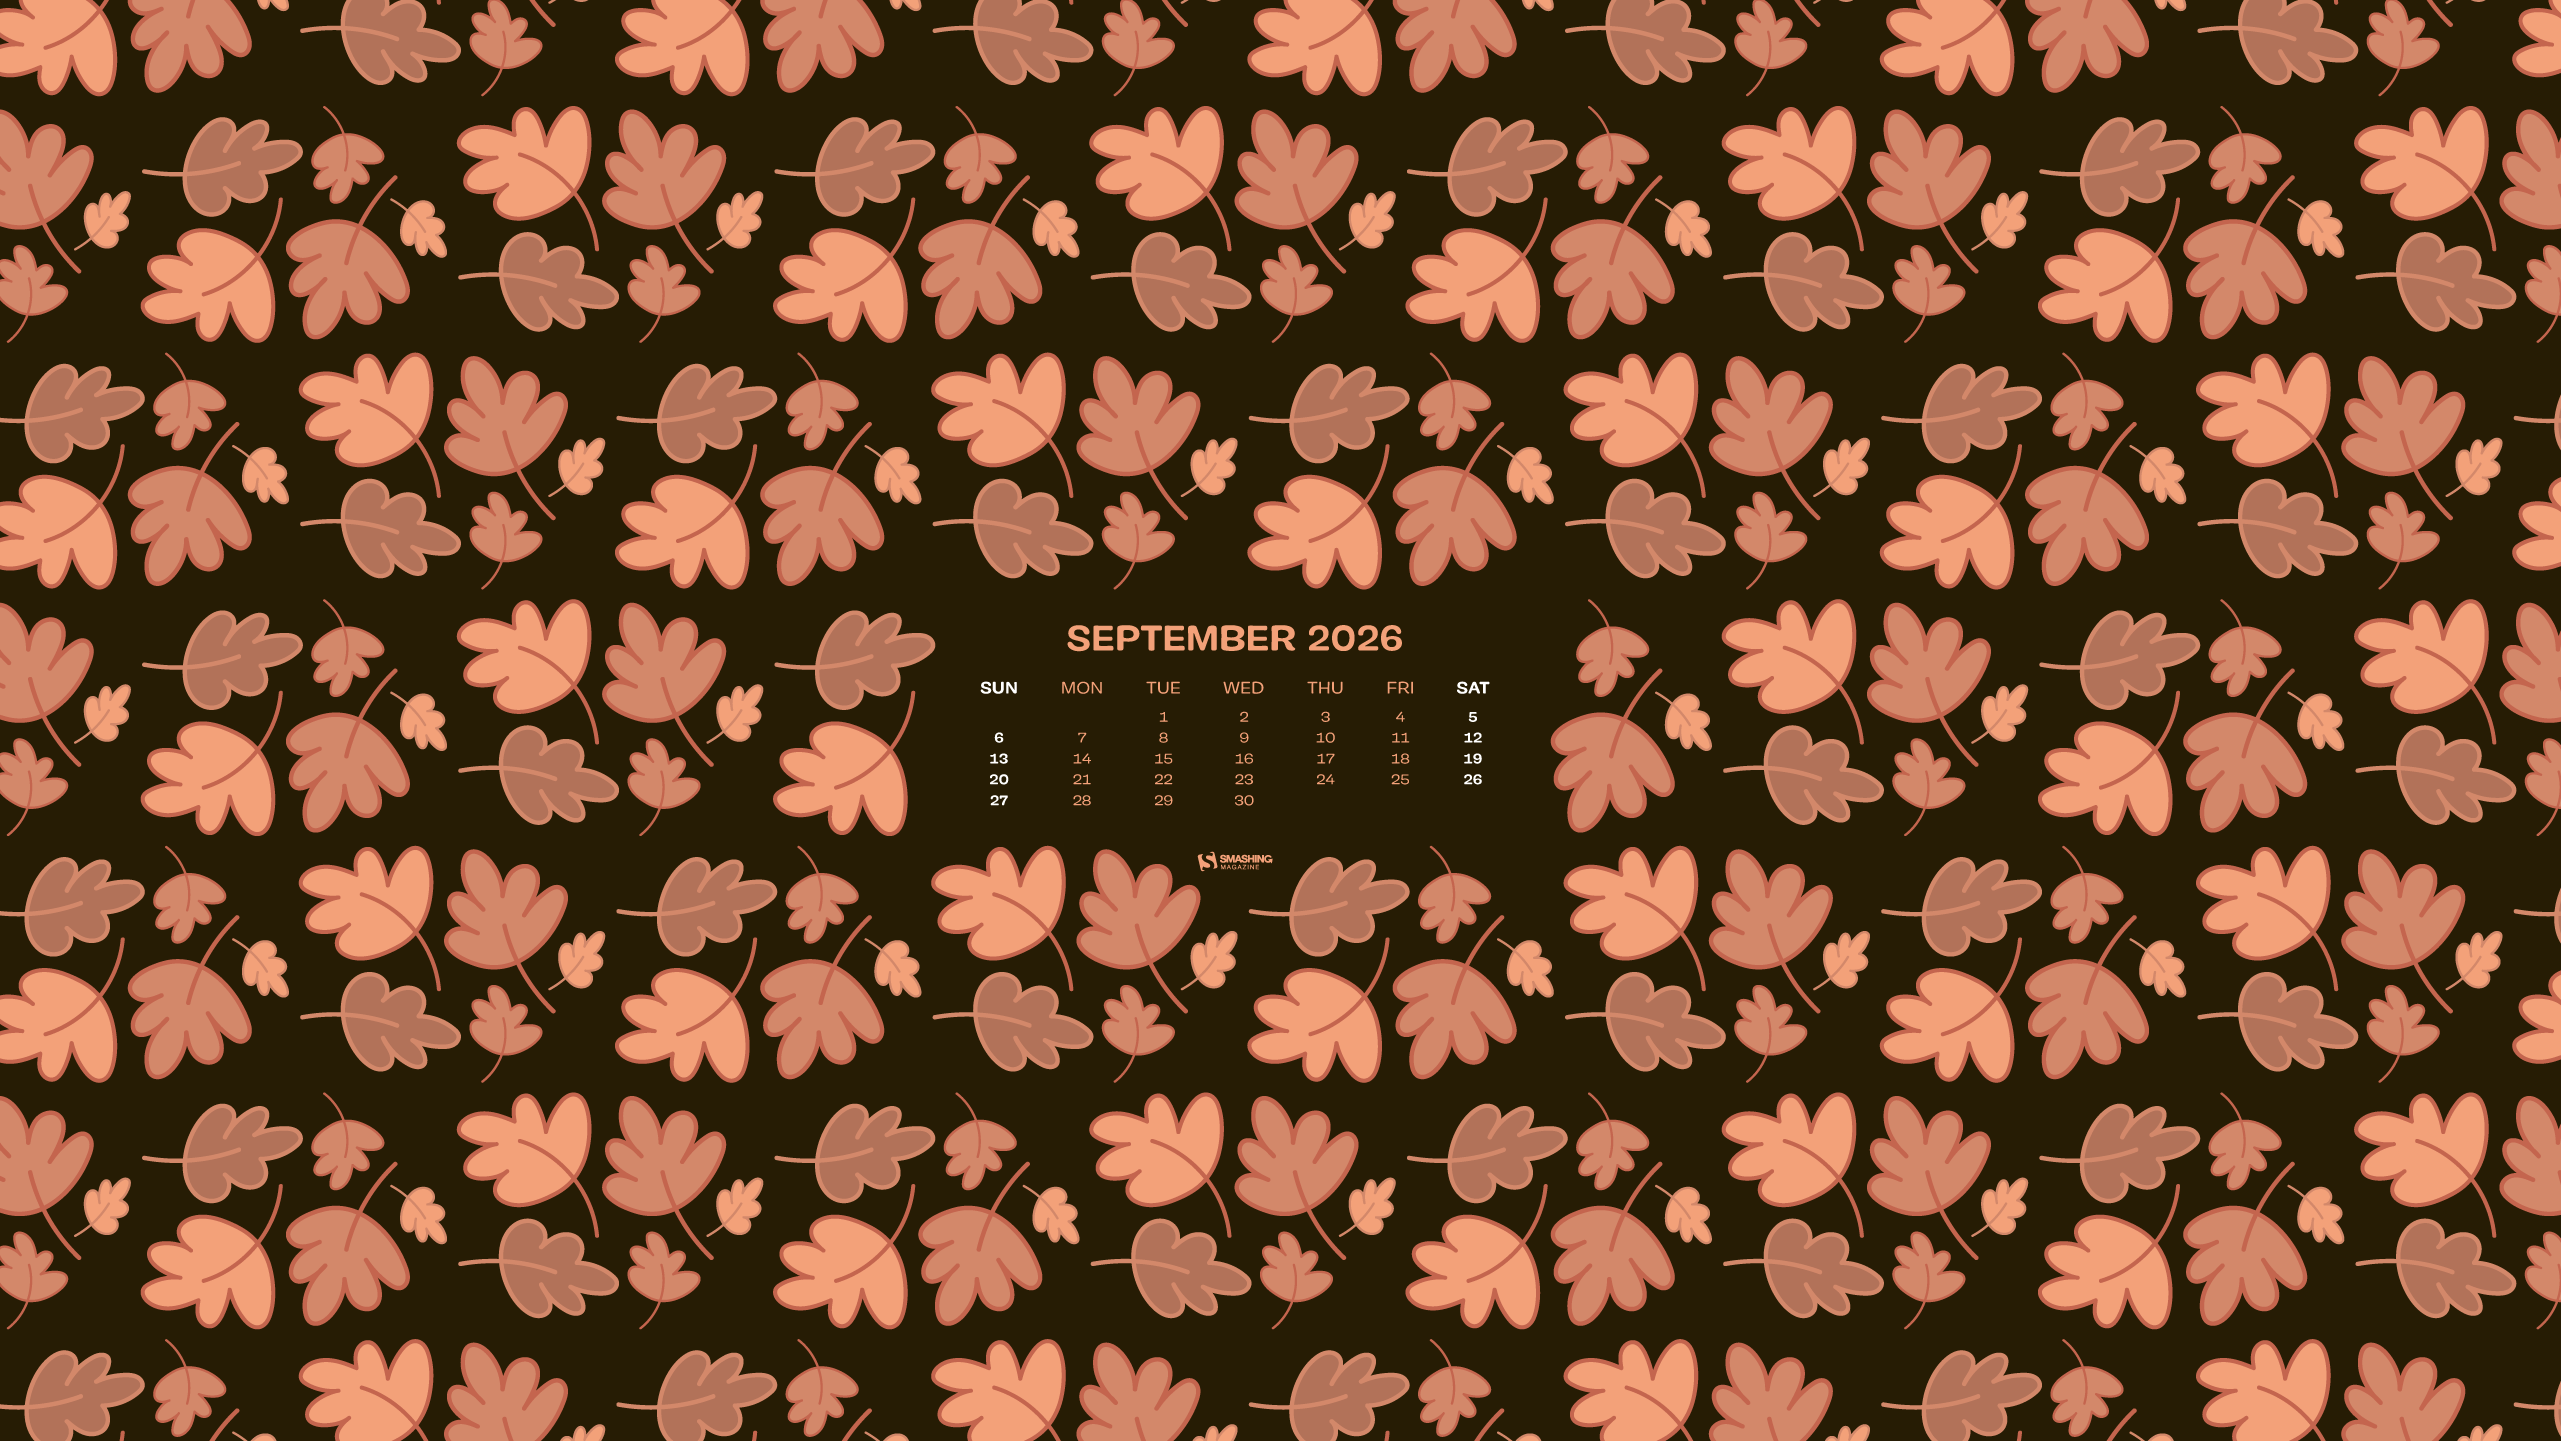
“That crisp, golden shift in the air when the first fallen leaves begin to blanket the streets of Novi Sad always brings a quiet transition into a slower rhythm. The goal was to capture that cozy, enveloping feeling of the changing seasons through a simple illustration, the way a woodland canopy naturally forms an archway, framing the workspace in rich amber, rust, and deep burgundy.” — Designed by Popart Studio from Serbia.

- preview
- with calendar: 320x480, 640x480, 800x480, 800x600, 1024x768, 1024x1024, 1152x864, 1280x720, 1280x800, 1280x960, 1280x1024, 1400x1050, 1440x900, 1600x1200, 1680x1050, 1680x1200, 1920x1080, 1920x1200, 1920x1440, 2560x1440
- without calendar: 320x480, 640x480, 800x480, 800x600, 1024x768, 1024x1024, 1152x864, 1280x720, 1280x800, 1280x960, 1280x1024, 1400x1050, 1440x900, 1600x1200, 1680x1050, 1680x1200, 1920x1080, 1920x1200, 1920x1440, 2560x1440









































Designed by Ricardo Gimenes from Spain.
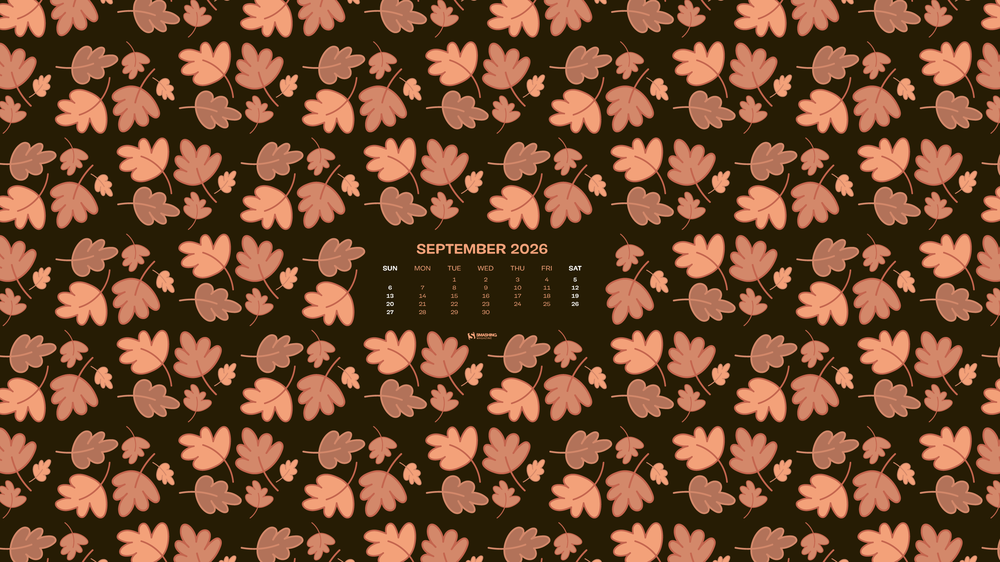
- preview
- with calendar: 640x480, 800x480, 800x600, 1024x768, 1024x1024, 1152x864, 1280x720, 1280x800, 1280x960, 1280x1024, 1366x768, 1400x1050, 1440x900, 1600x1200, 1680x1050, 1680x1200, 1920x1080, 1920x1200, 1920x1440, 2560x1440
- without calendar: 640x480, 800x480, 800x600, 1024x768, 1024x1024, 1152x864, 1280x720, 1280x800, 1280x960, 1280x1024, 1366x768, 1400x1050, 1440x900, 1600x1200, 1680x1050, 1680x1200, 1920x1080, 1920x1200, 1920x1440, 2560x1440
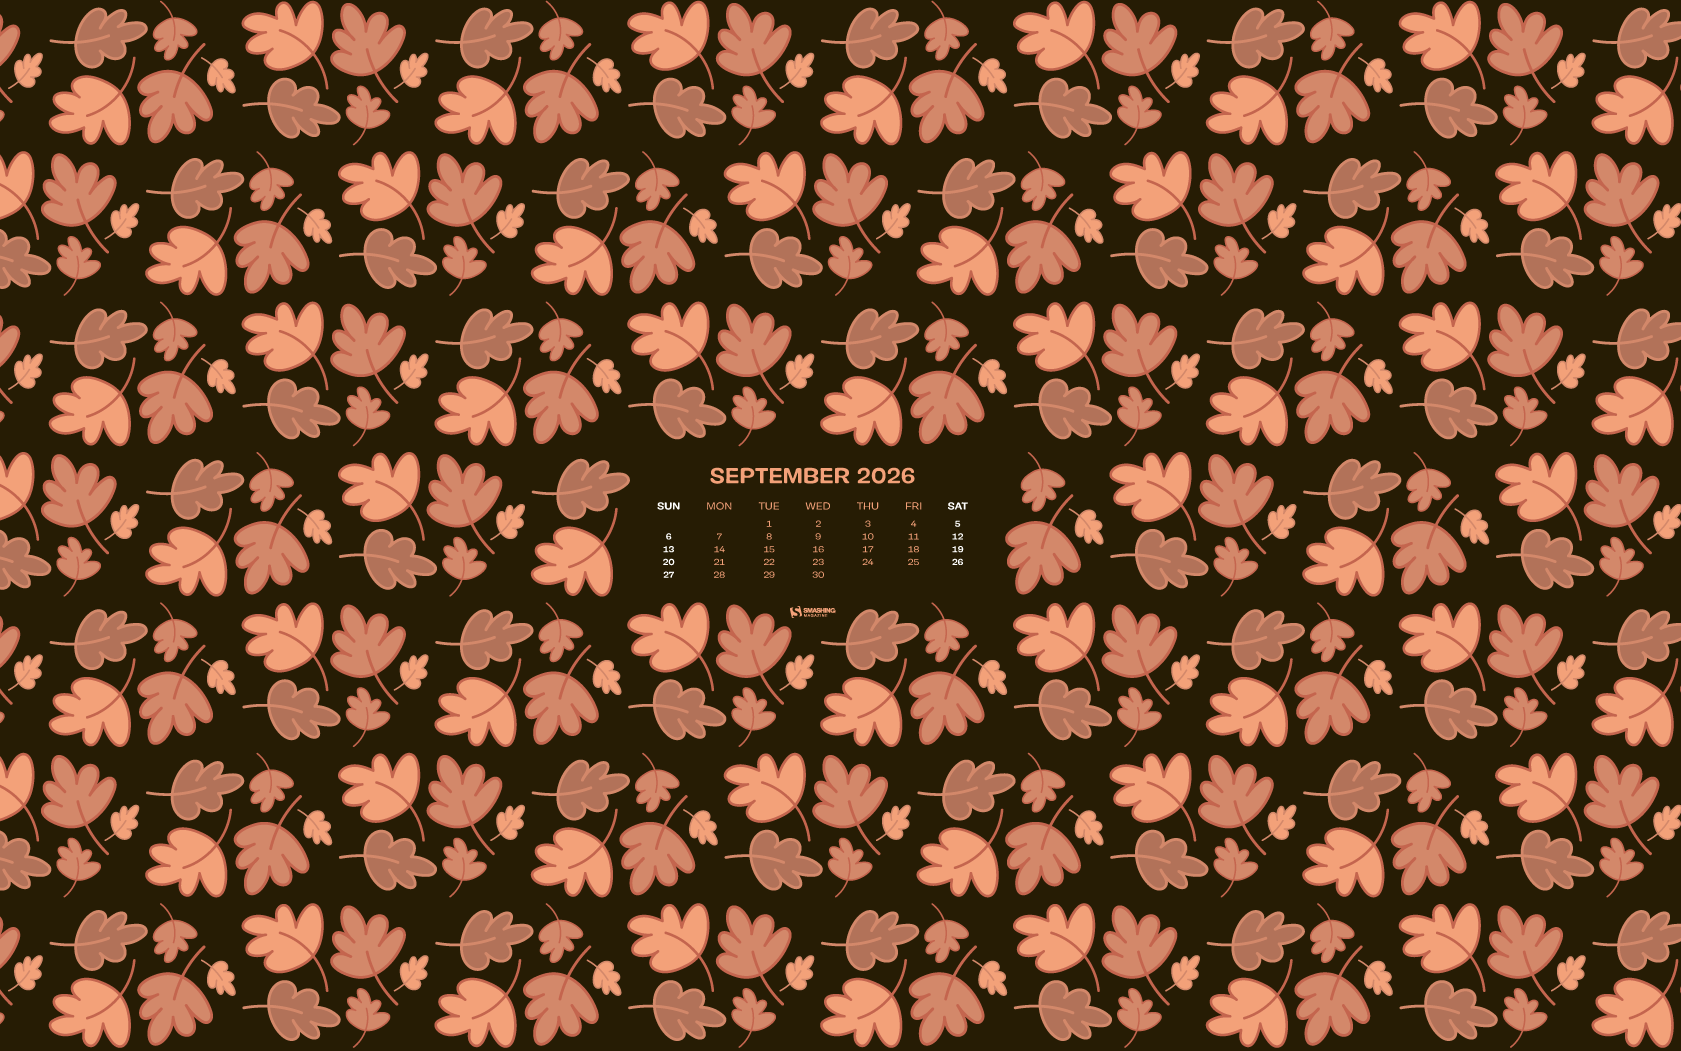
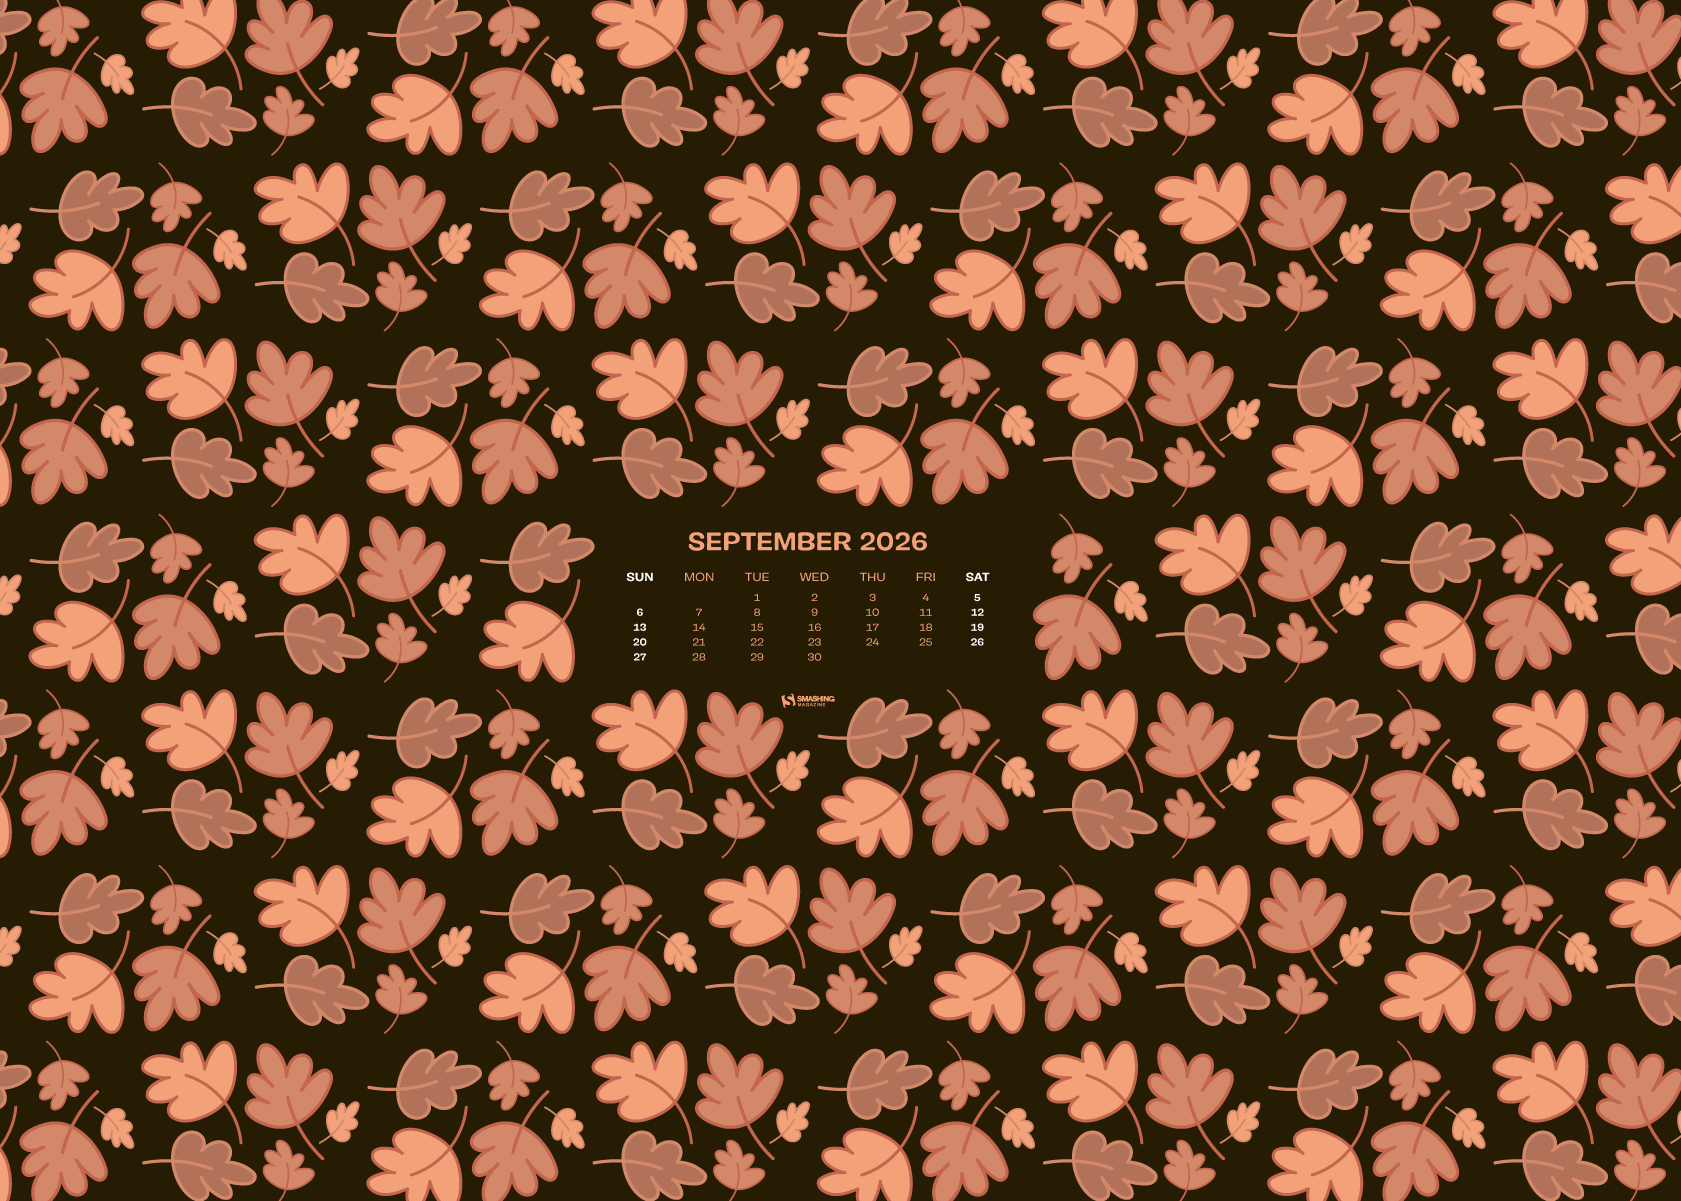

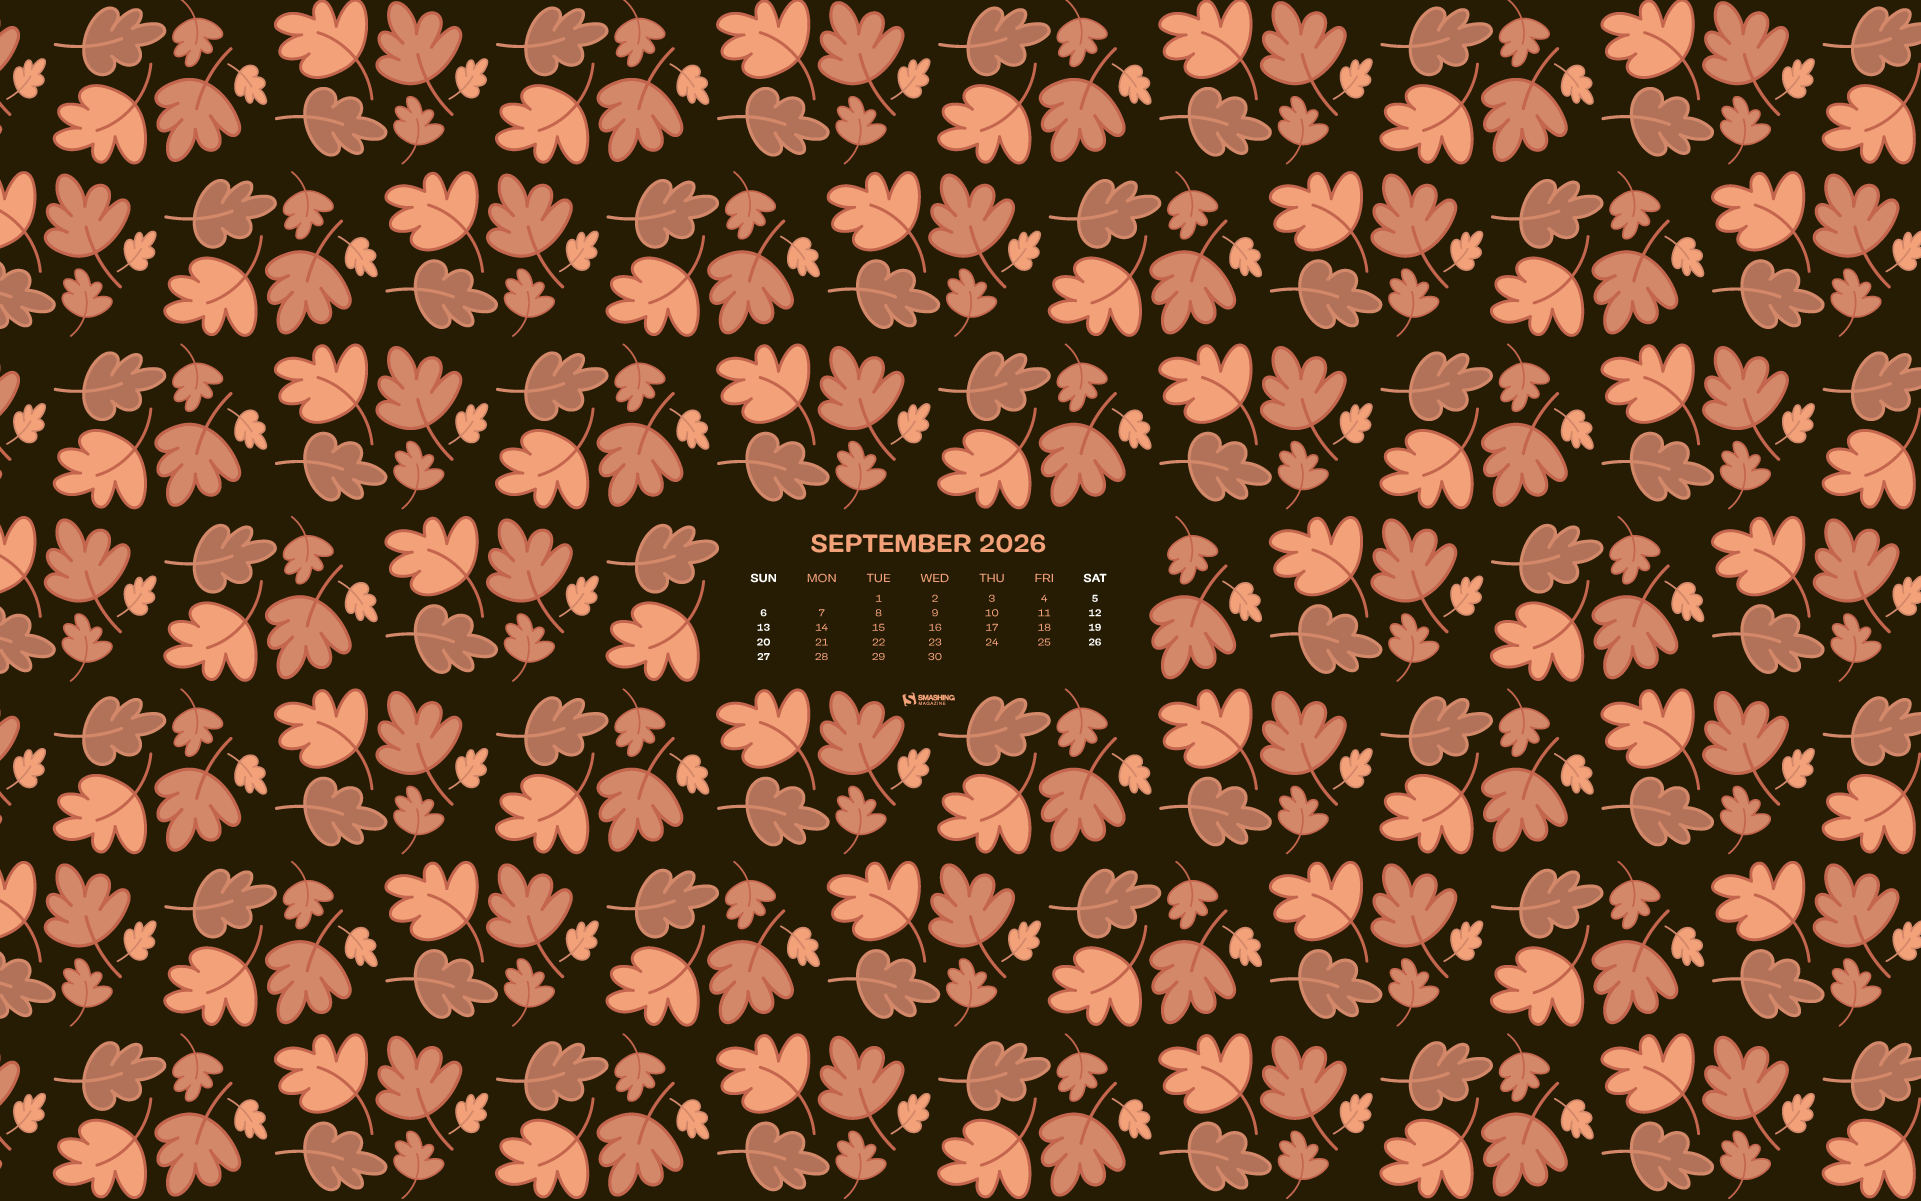
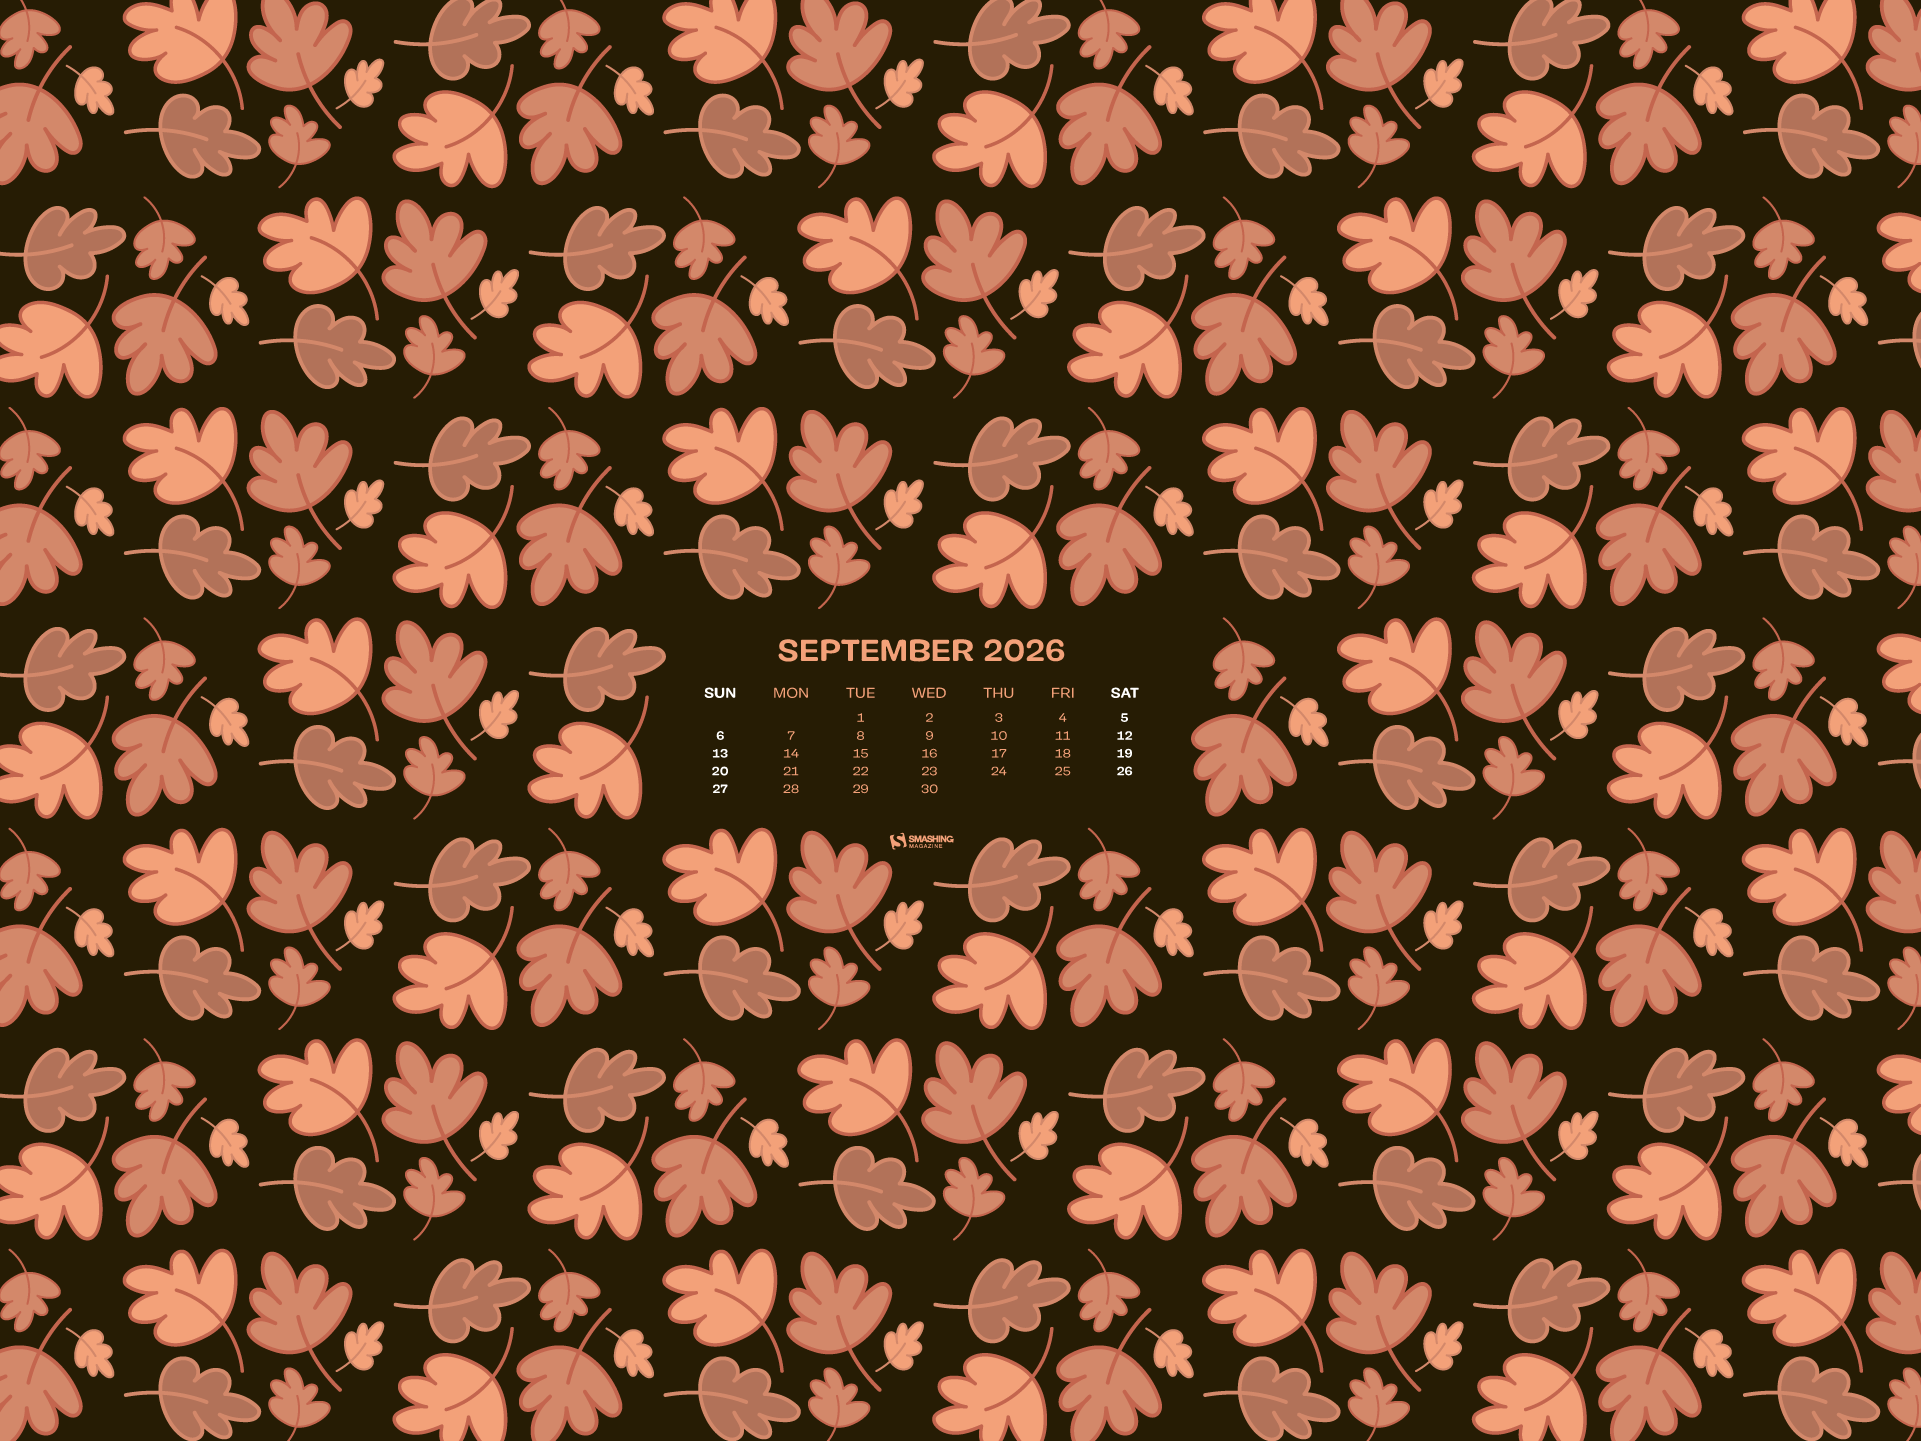




















Designed by Ricardo Gimenes from Spain.
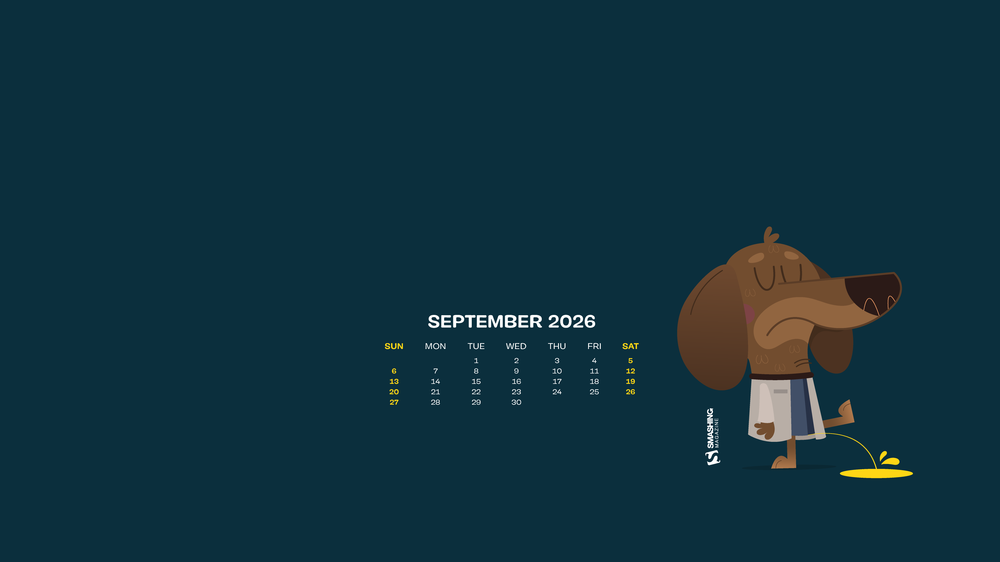
- preview
- with calendar: 640x480, 800x480, 800x600, 1024x768, 1024x1024, 1152x864, 1280x720, 1280x800, 1280x960, 1280x1024, 1366x768, 1400x1050, 1440x900, 1600x1200, 1680x1050, 1680x1200, 1920x1080, 1920x1200, 1920x1440, 2560x1440, 3840x2160
- without calendar: 640x480, 800x480, 800x600, 1024x768, 1024x1024, 1152x864, 1280x720, 1280x800, 1280x960, 1280x1024, 1366x768, 1400x1050, 1440x900, 1600x1200, 1680x1050, 1680x1200, 1920x1080, 1920x1200, 1920x1440, 2560x1440, 3840x2160
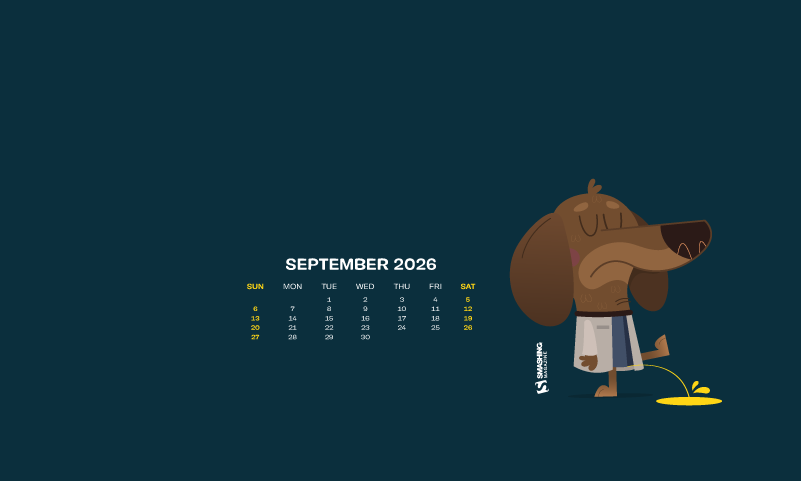
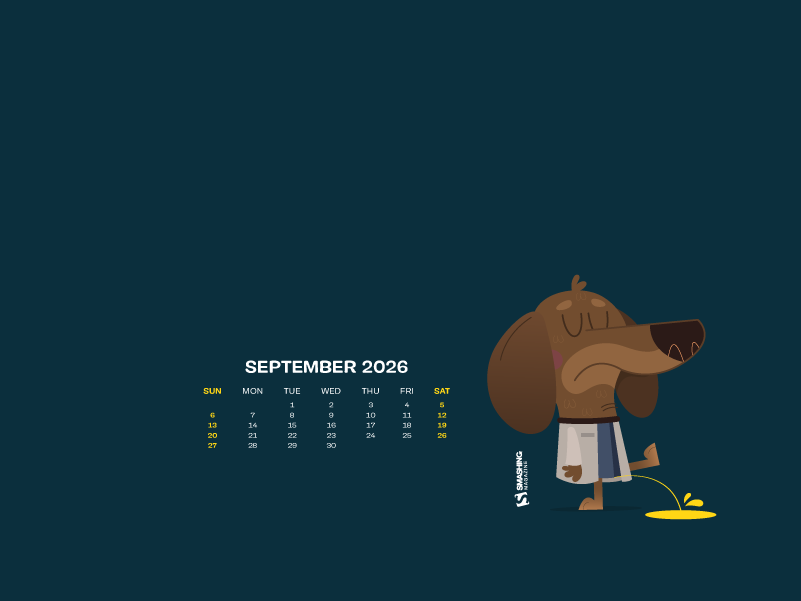
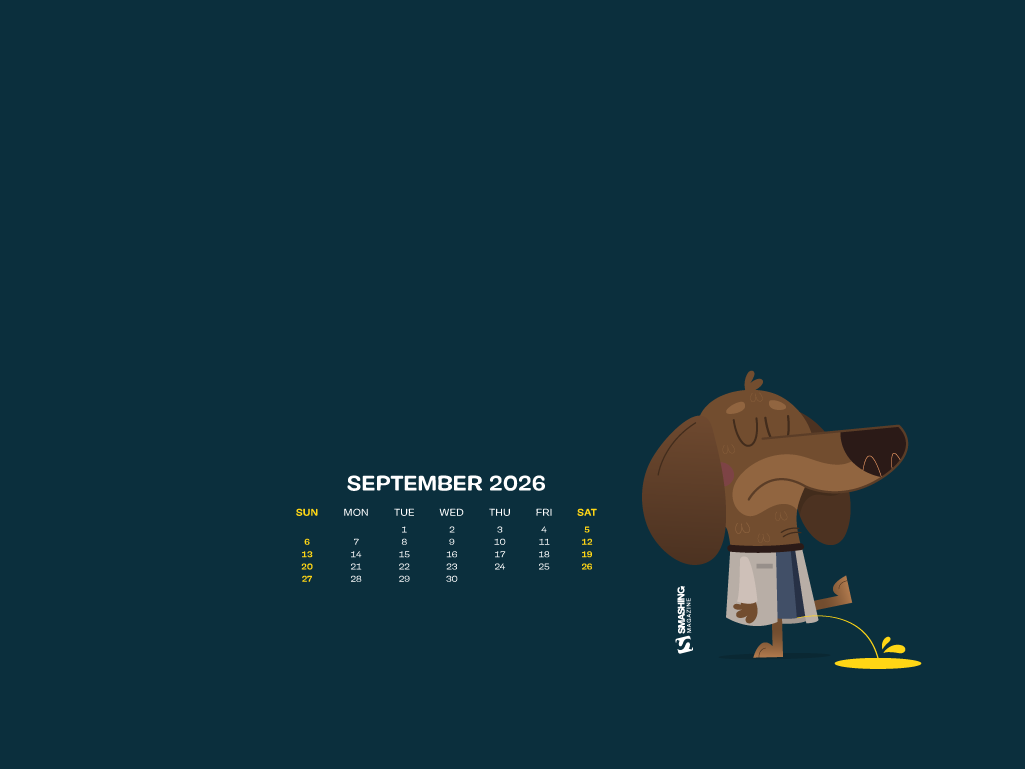
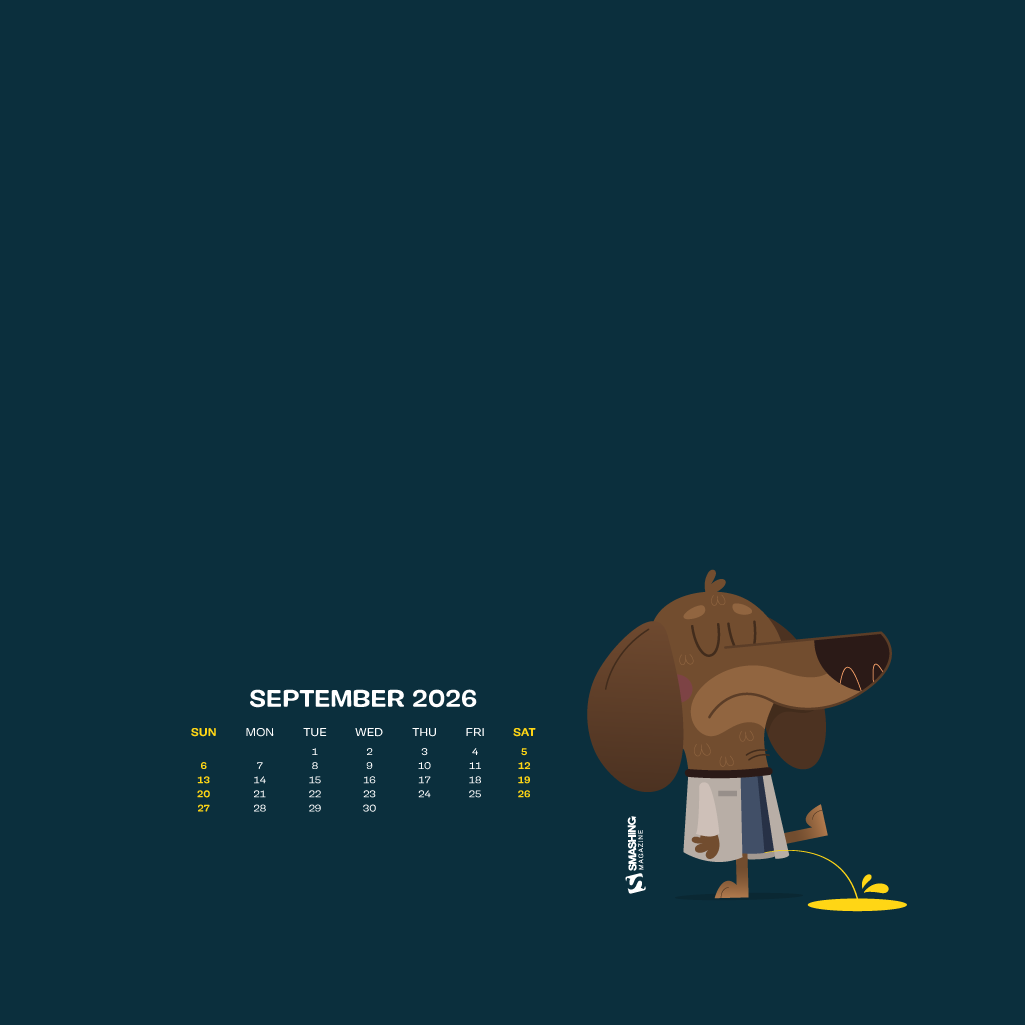
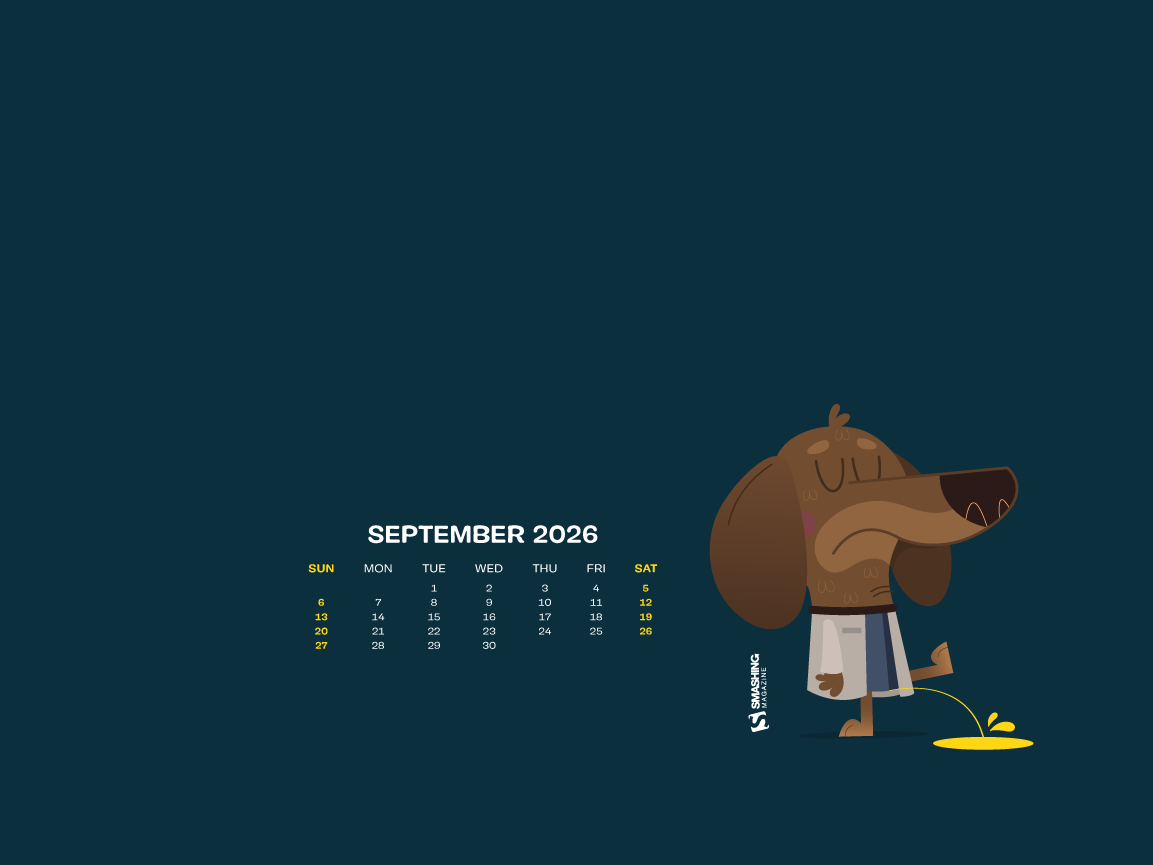
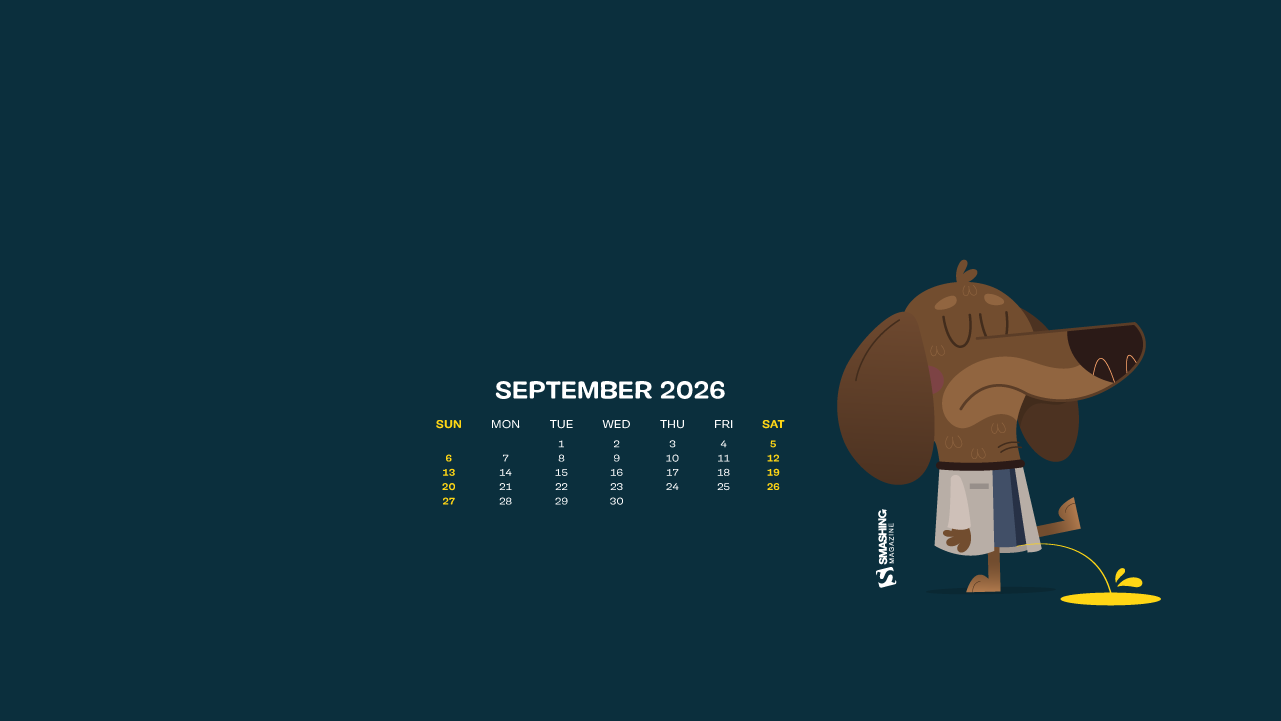
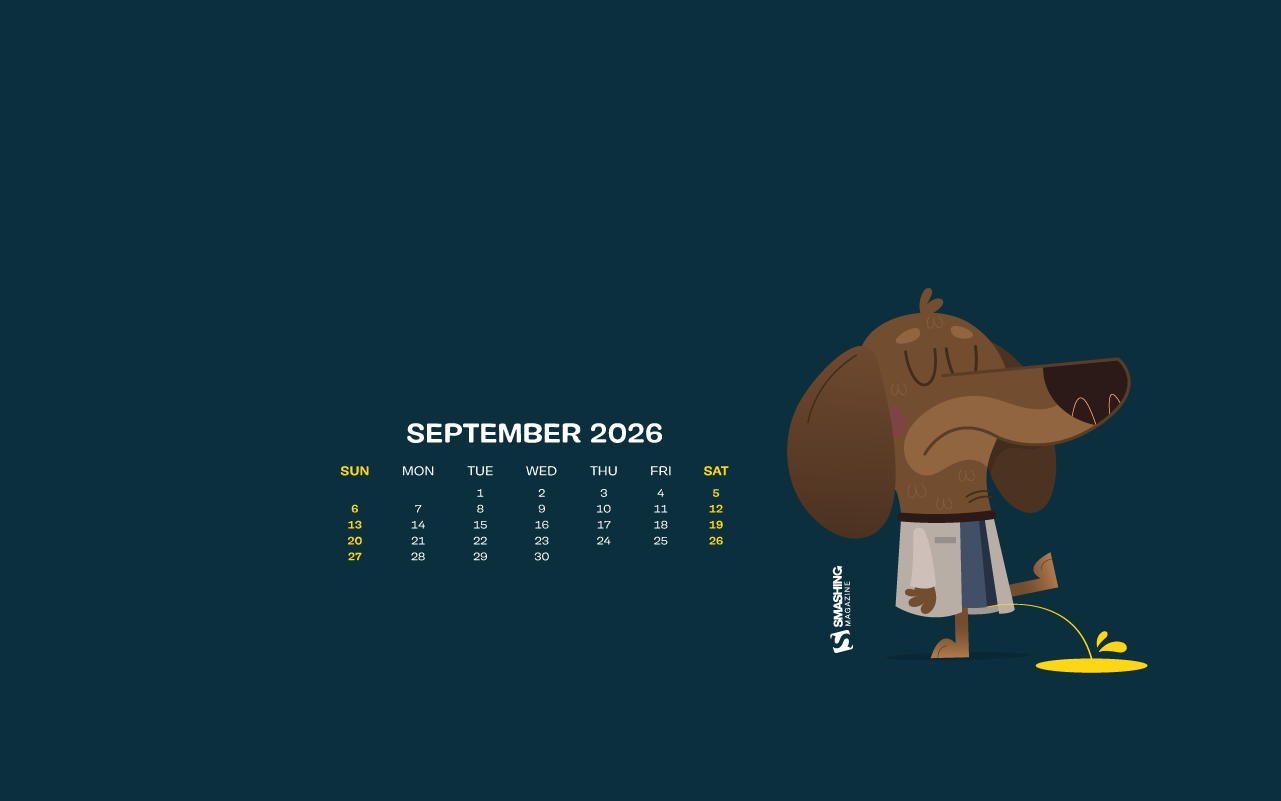
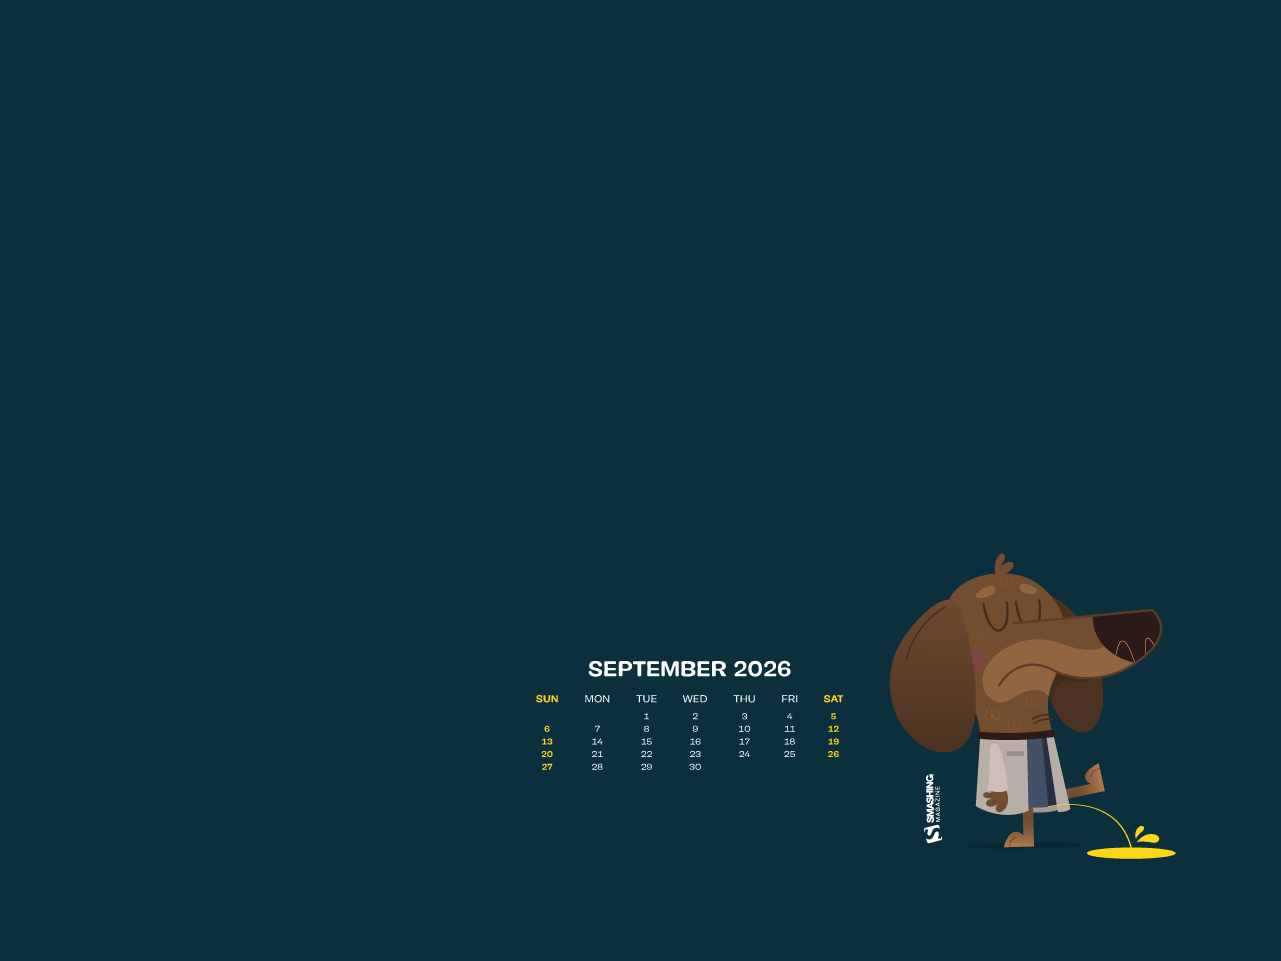
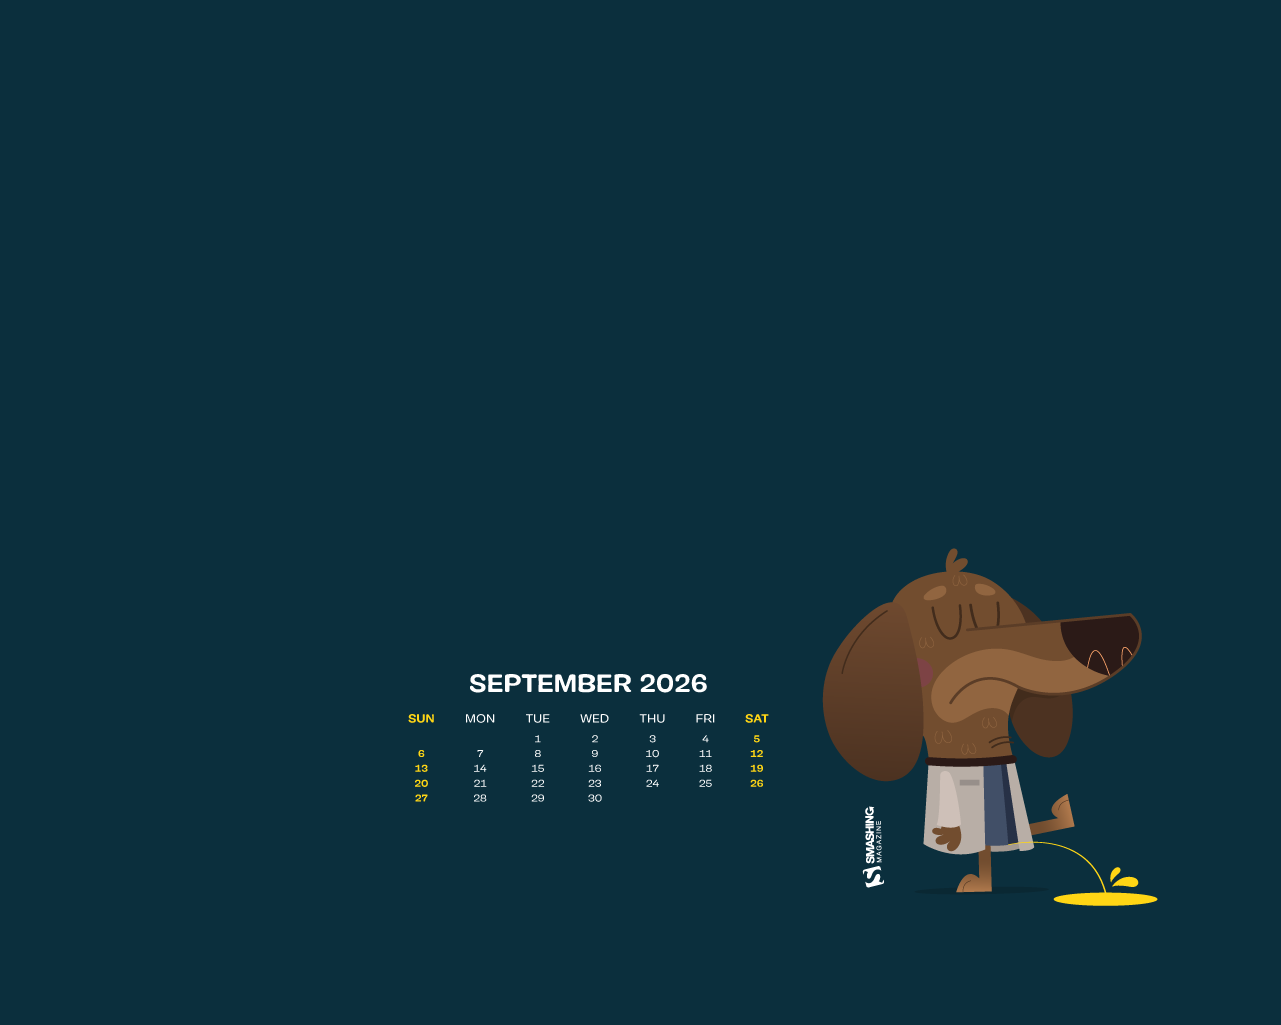
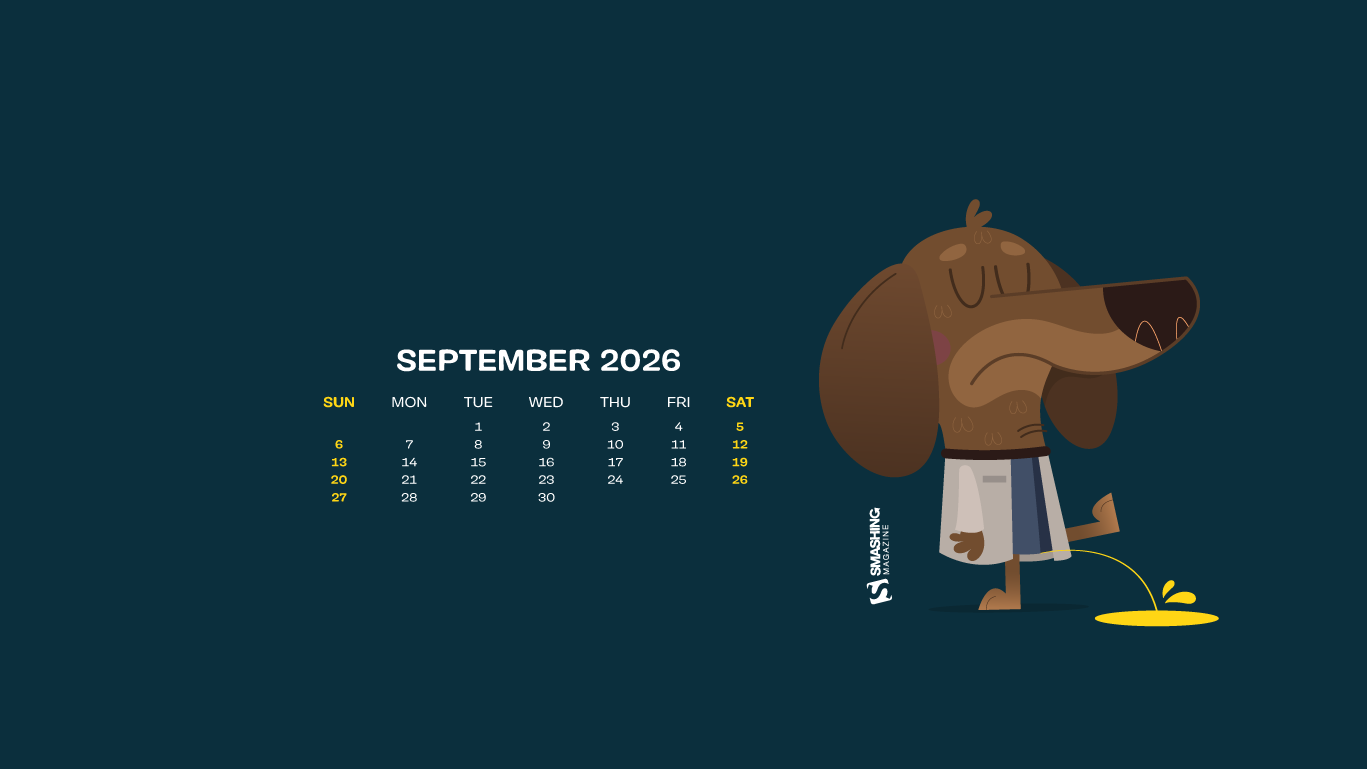
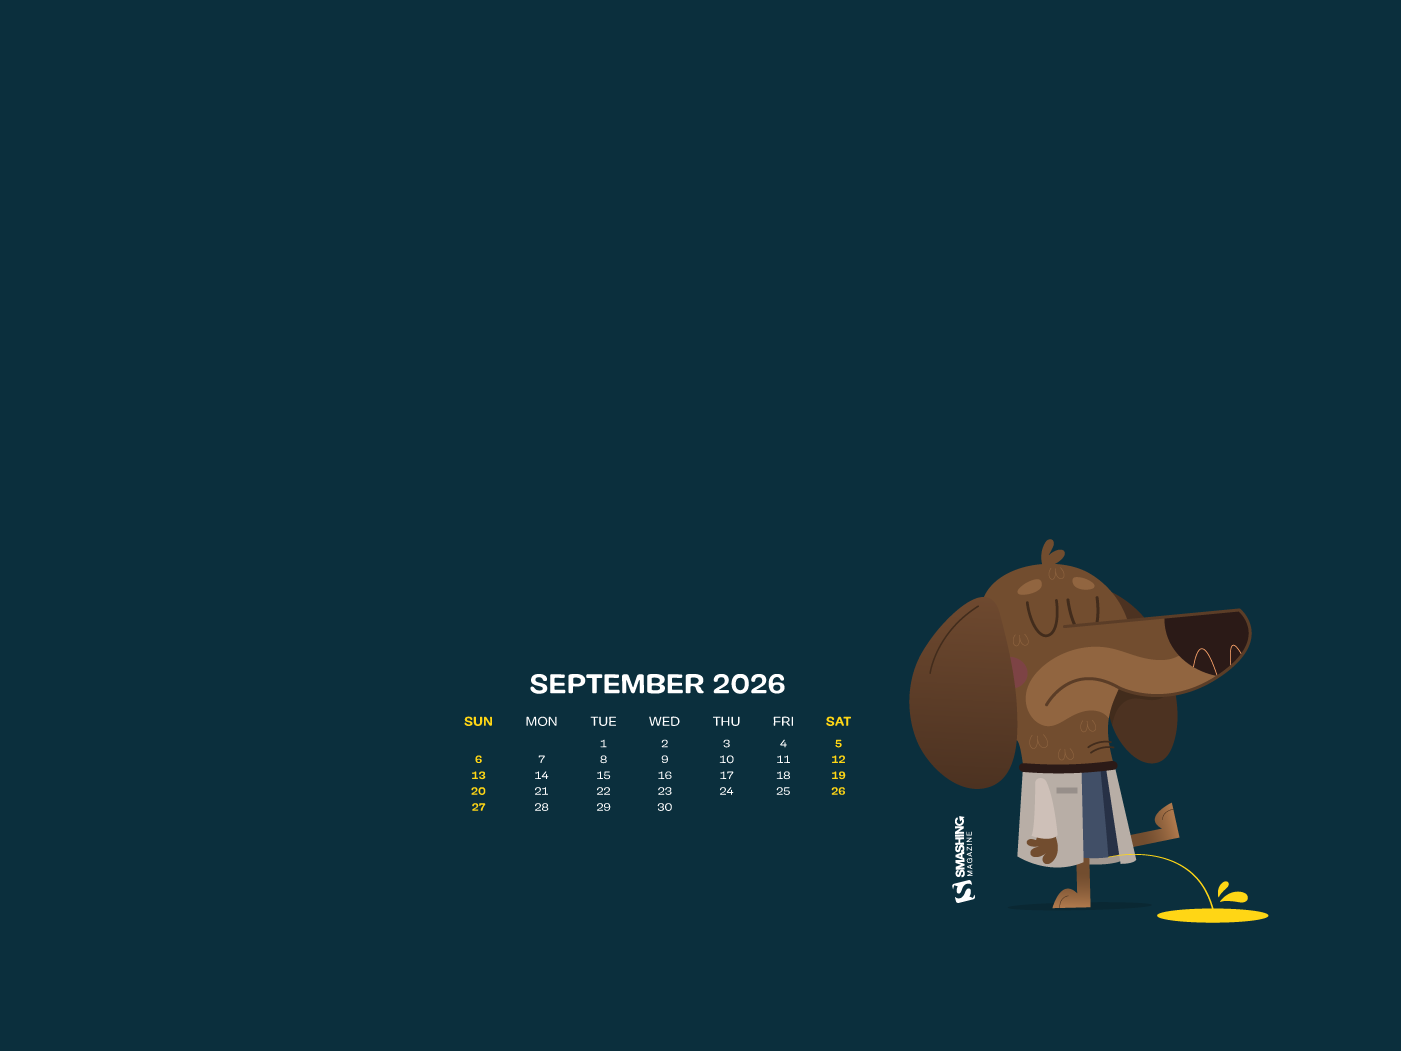
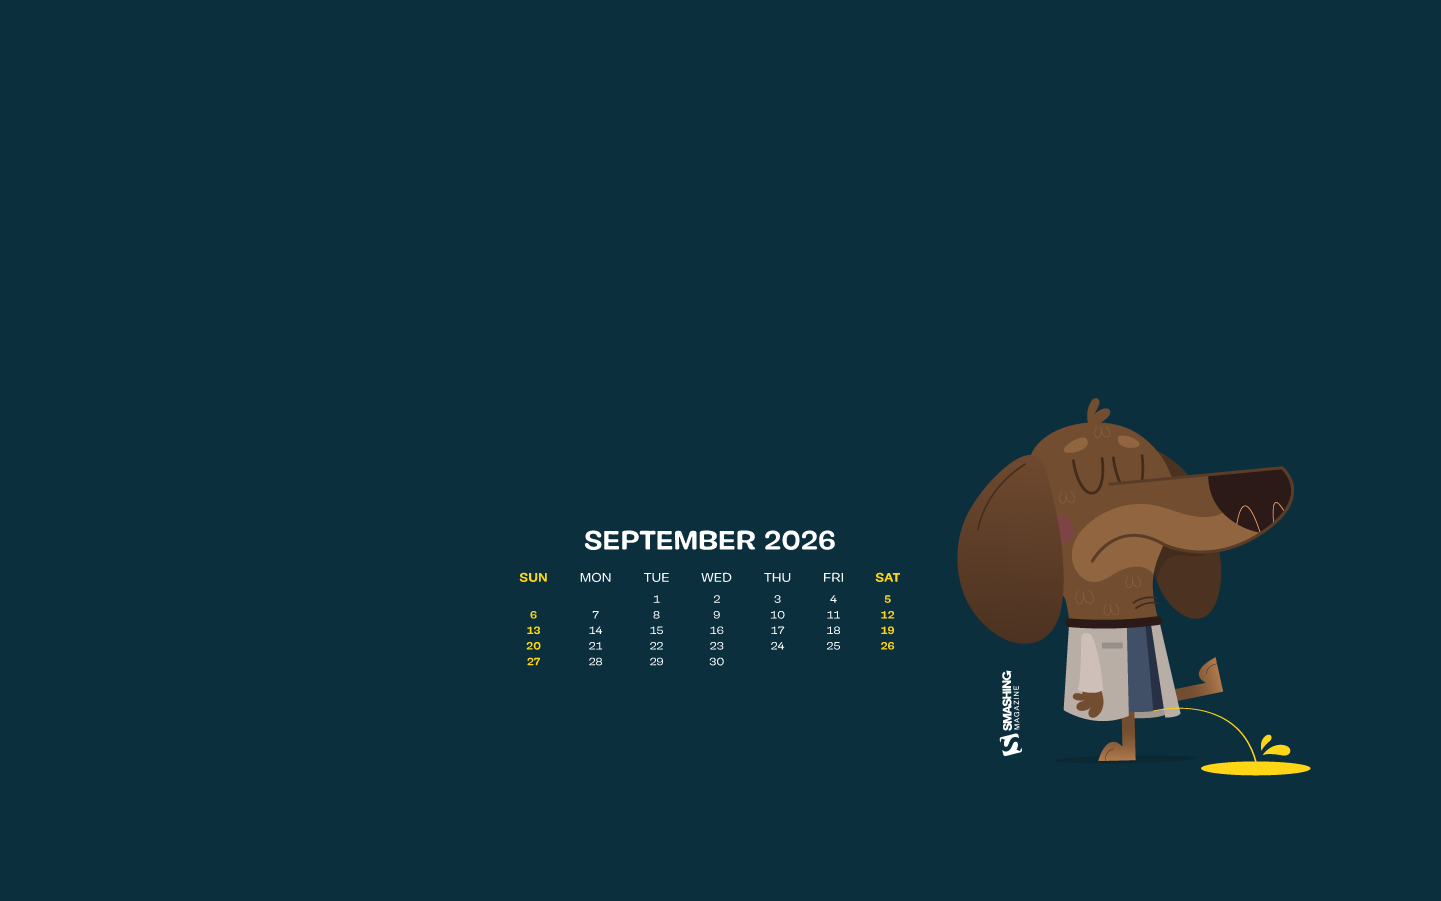
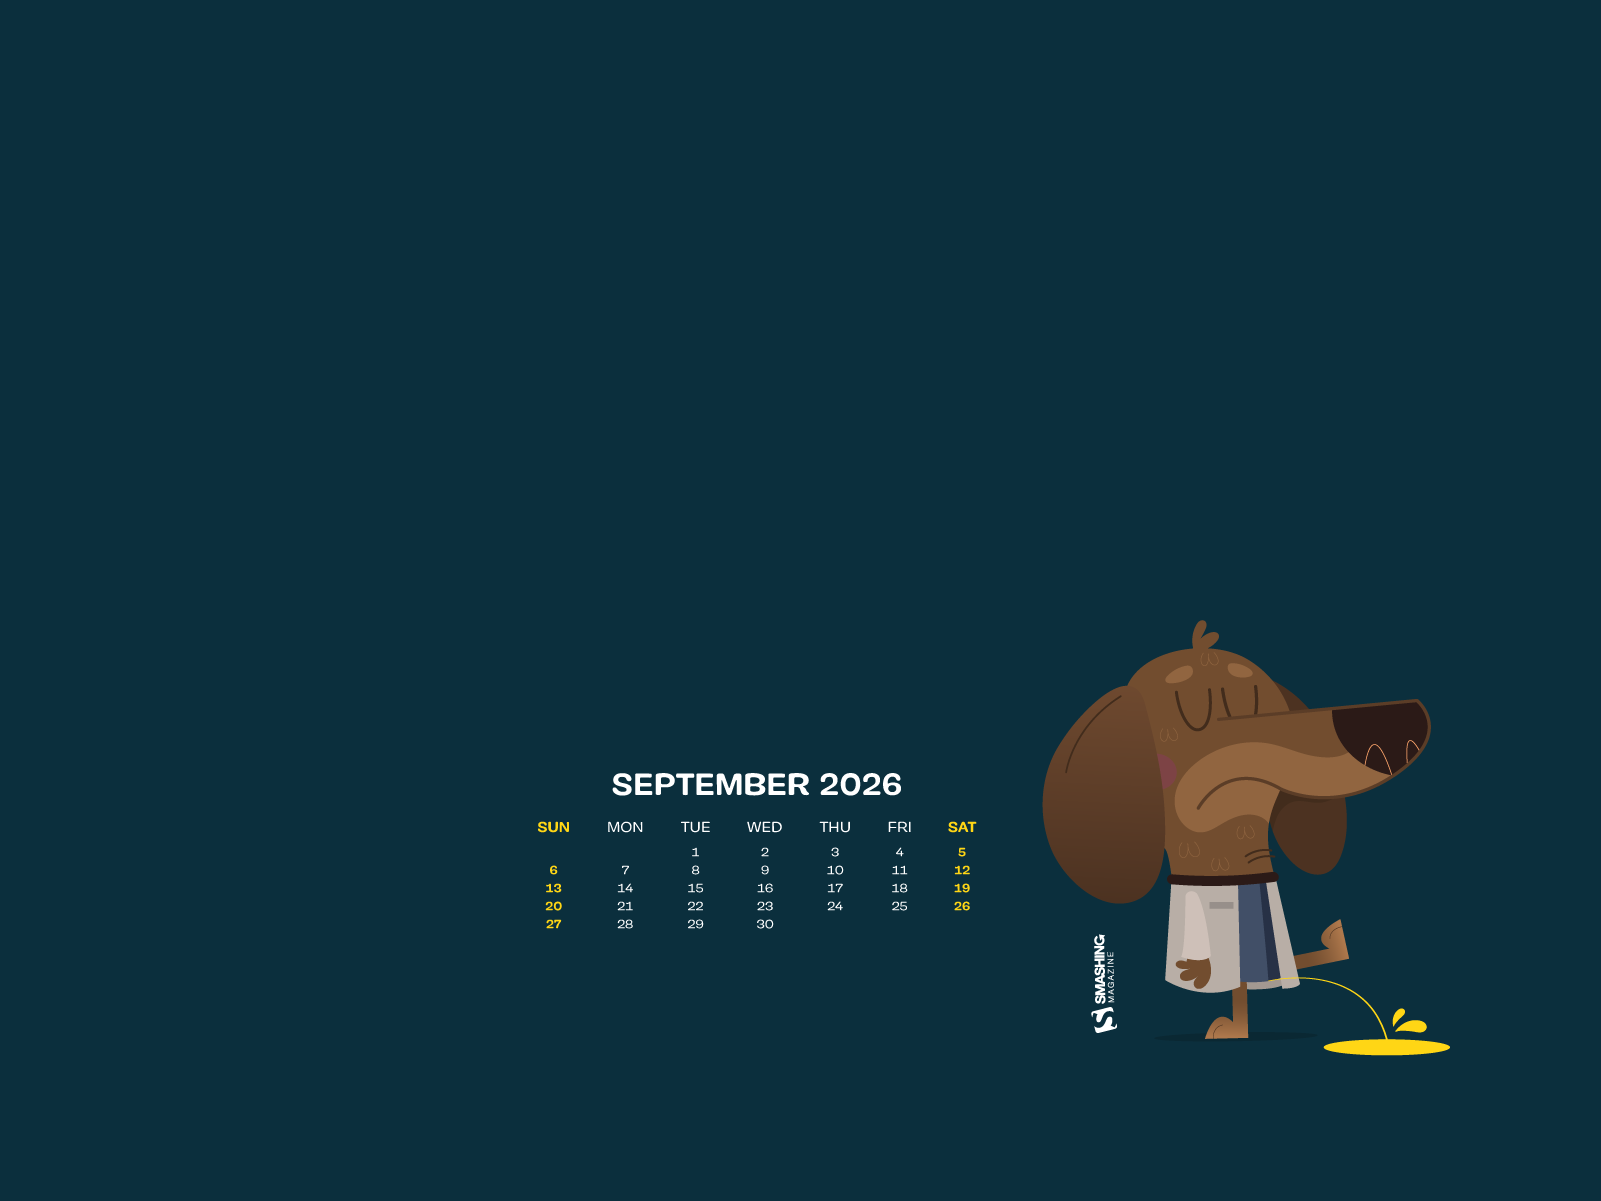
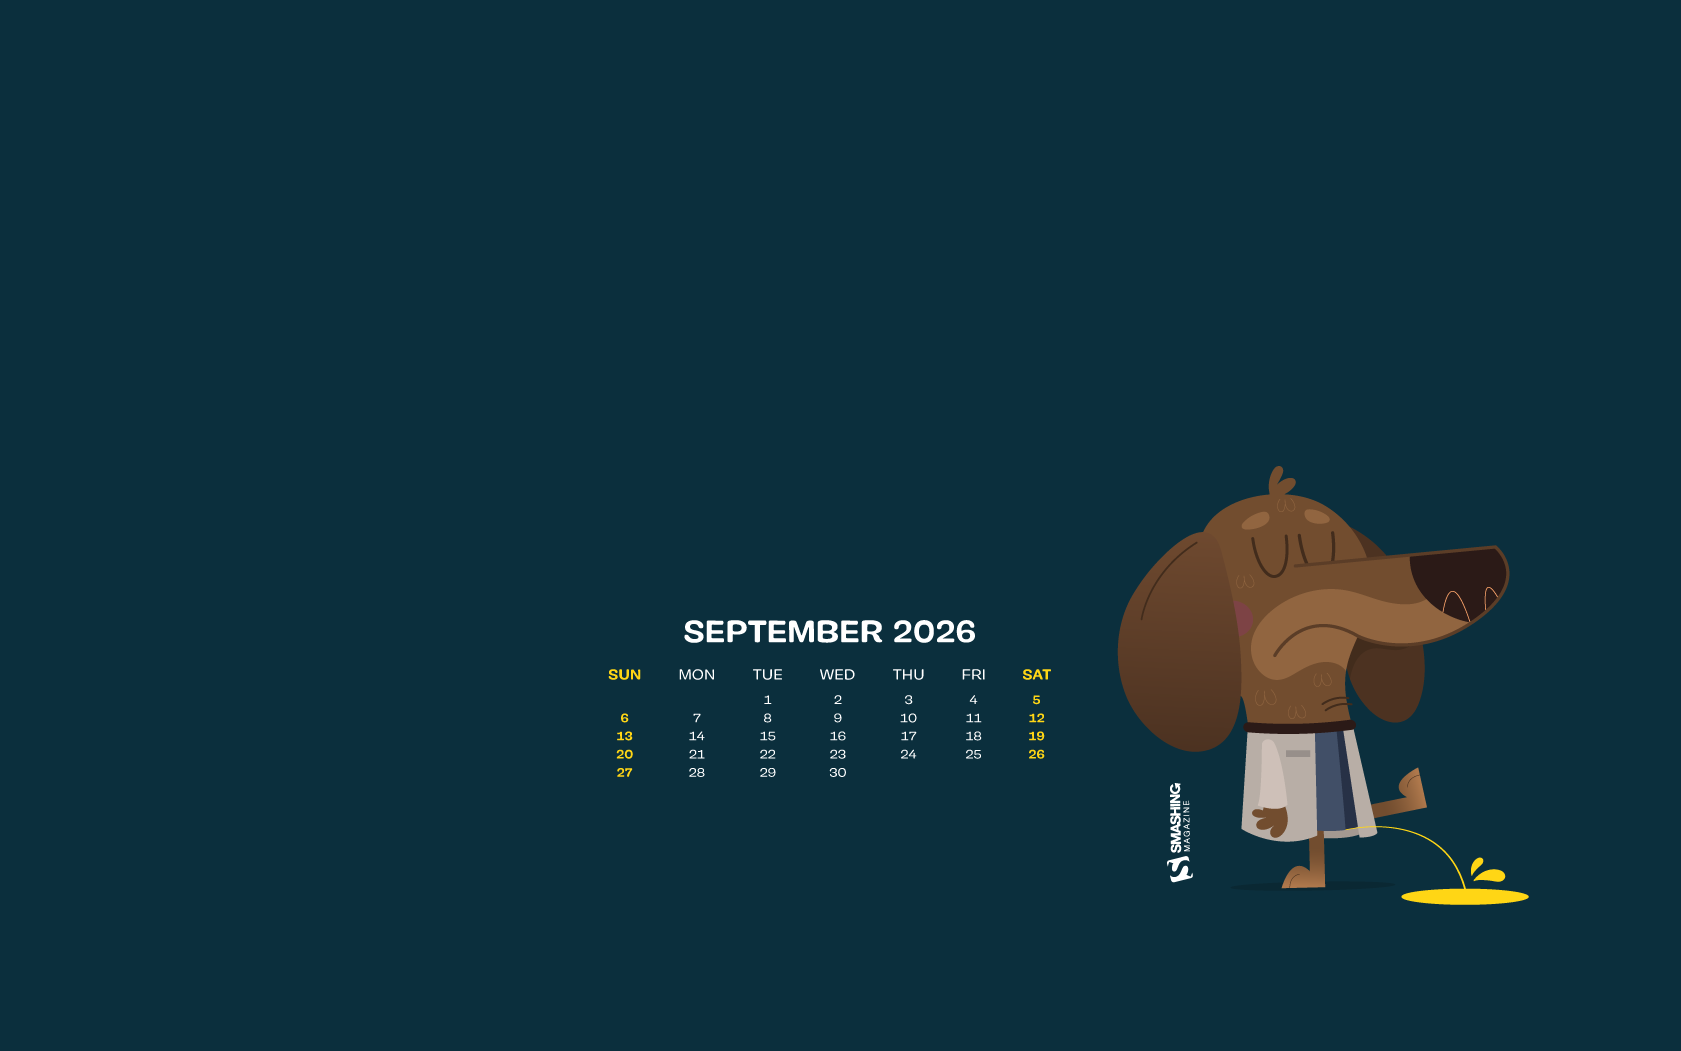
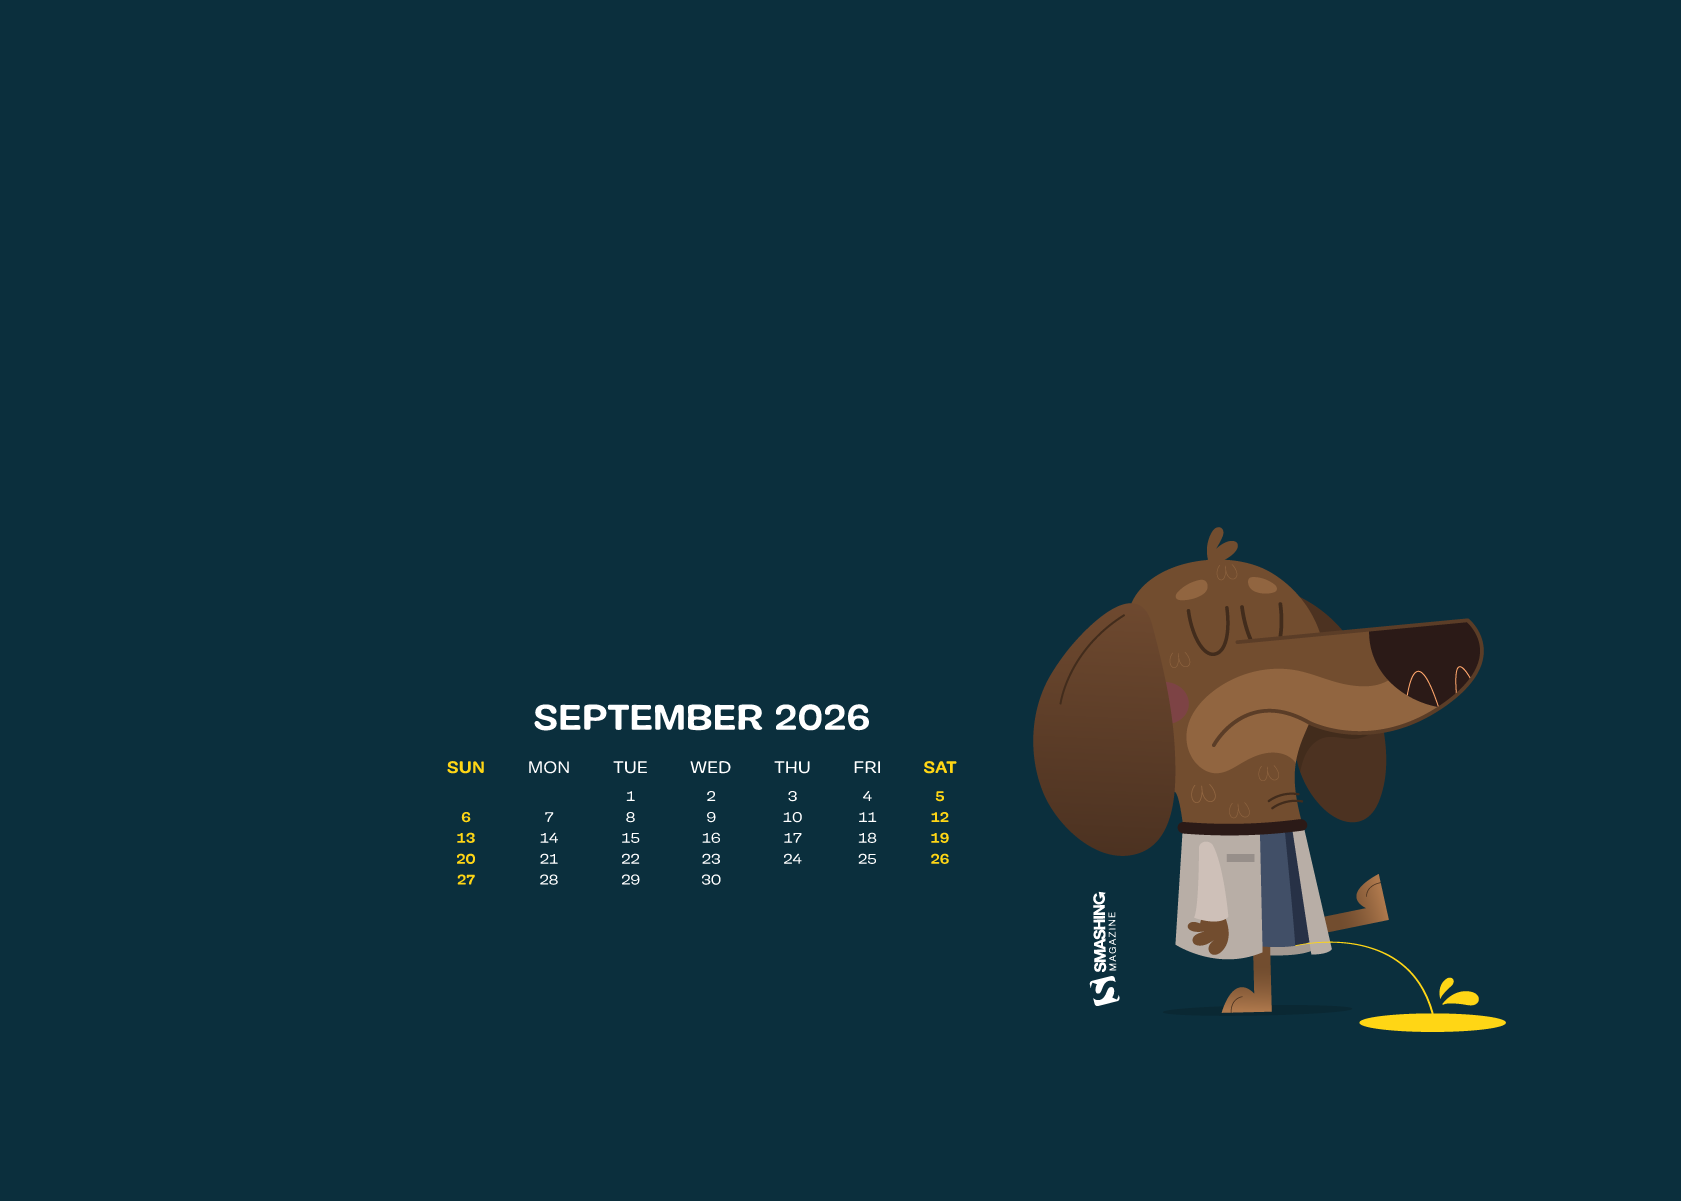
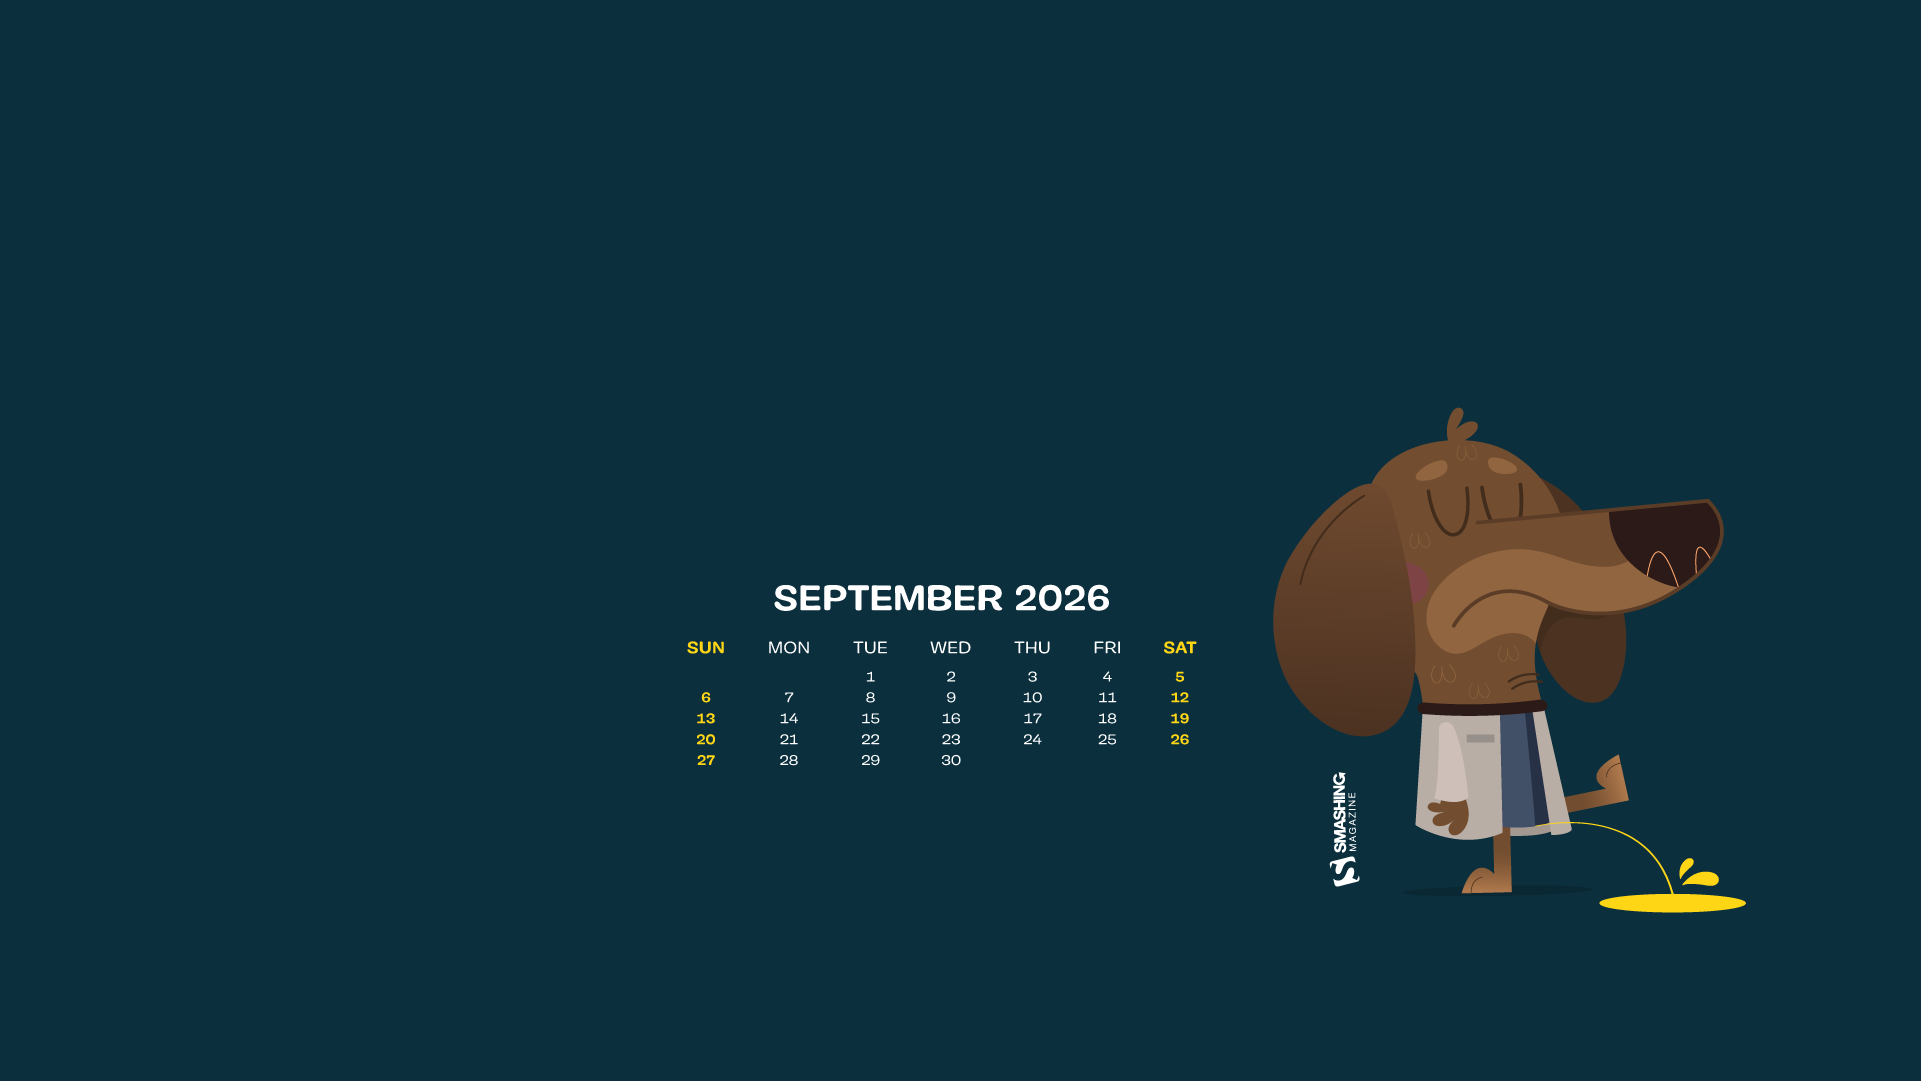
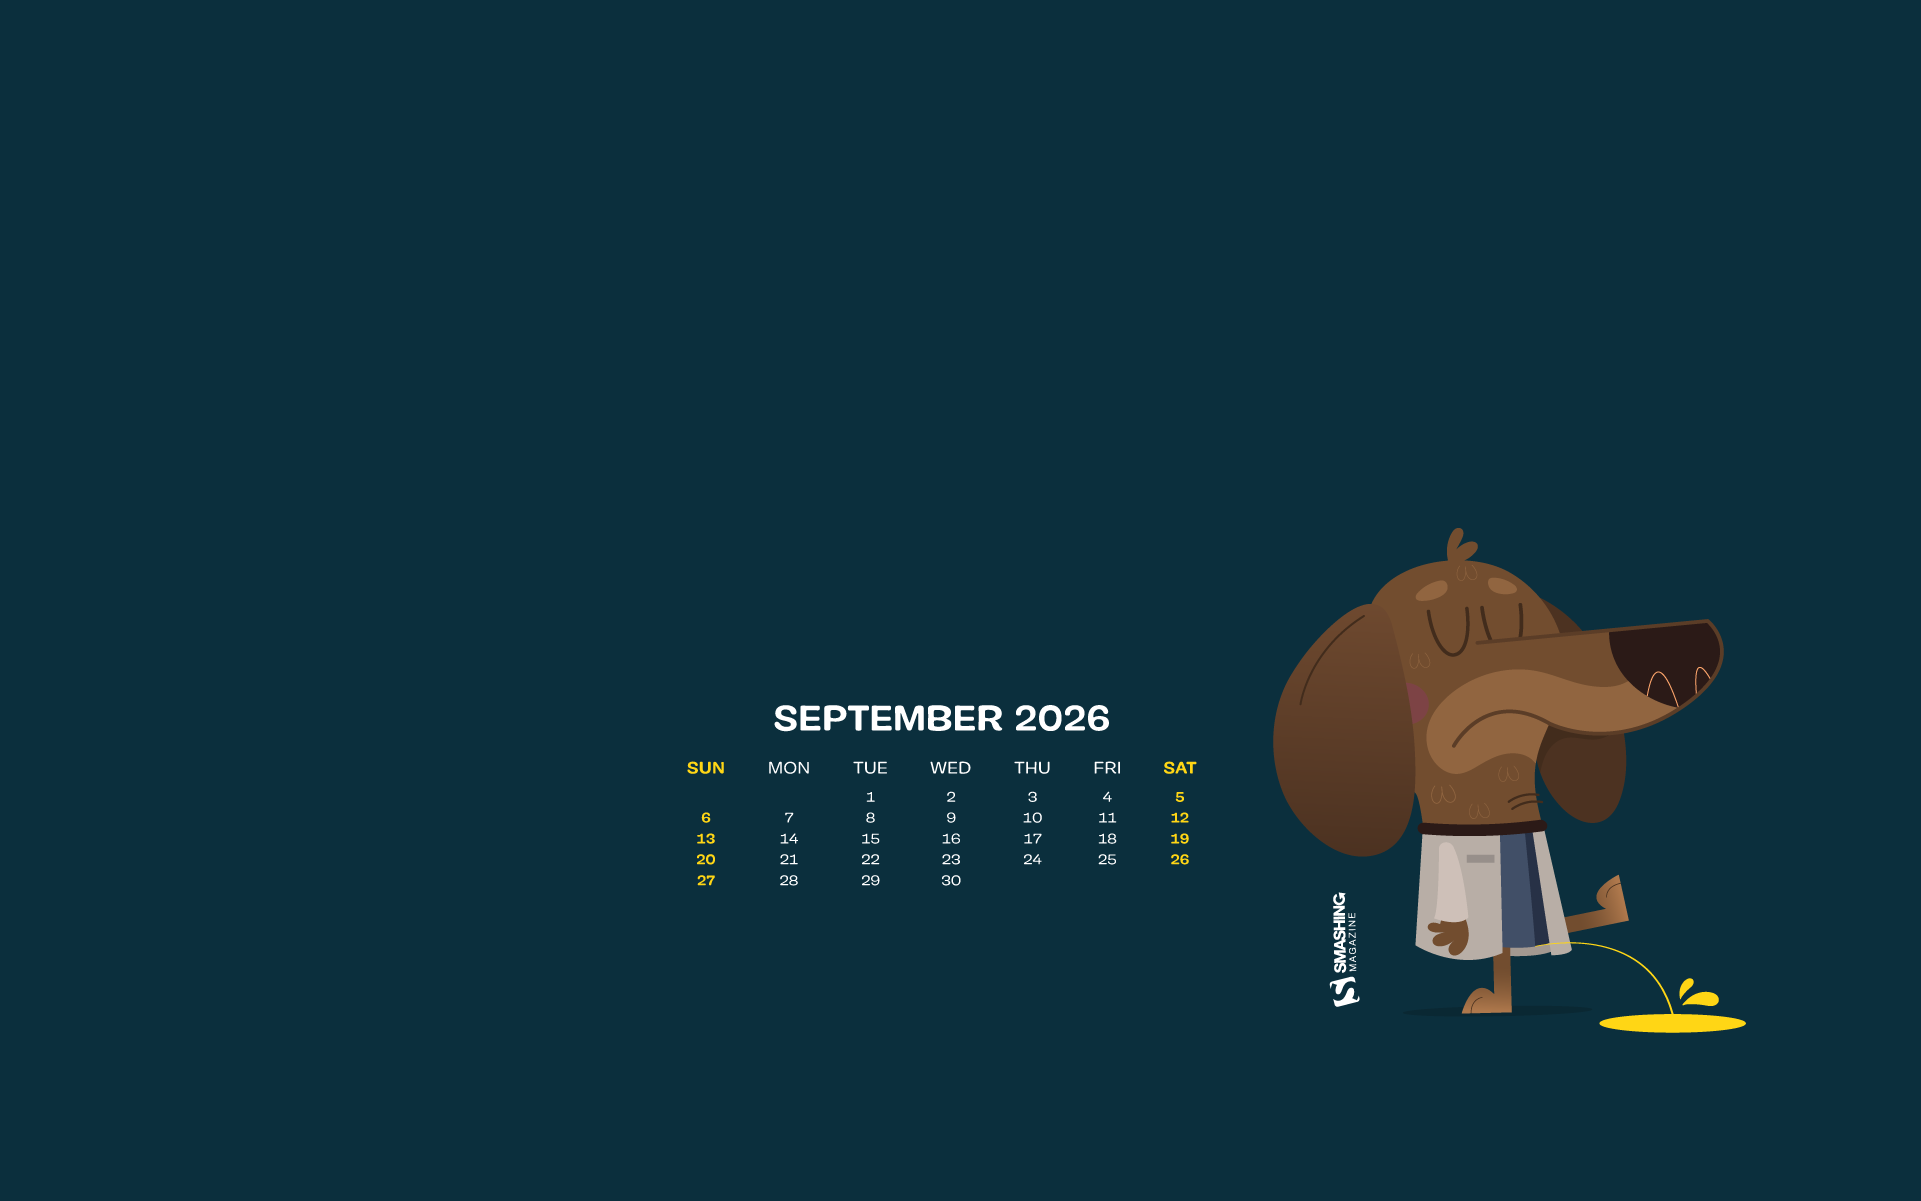
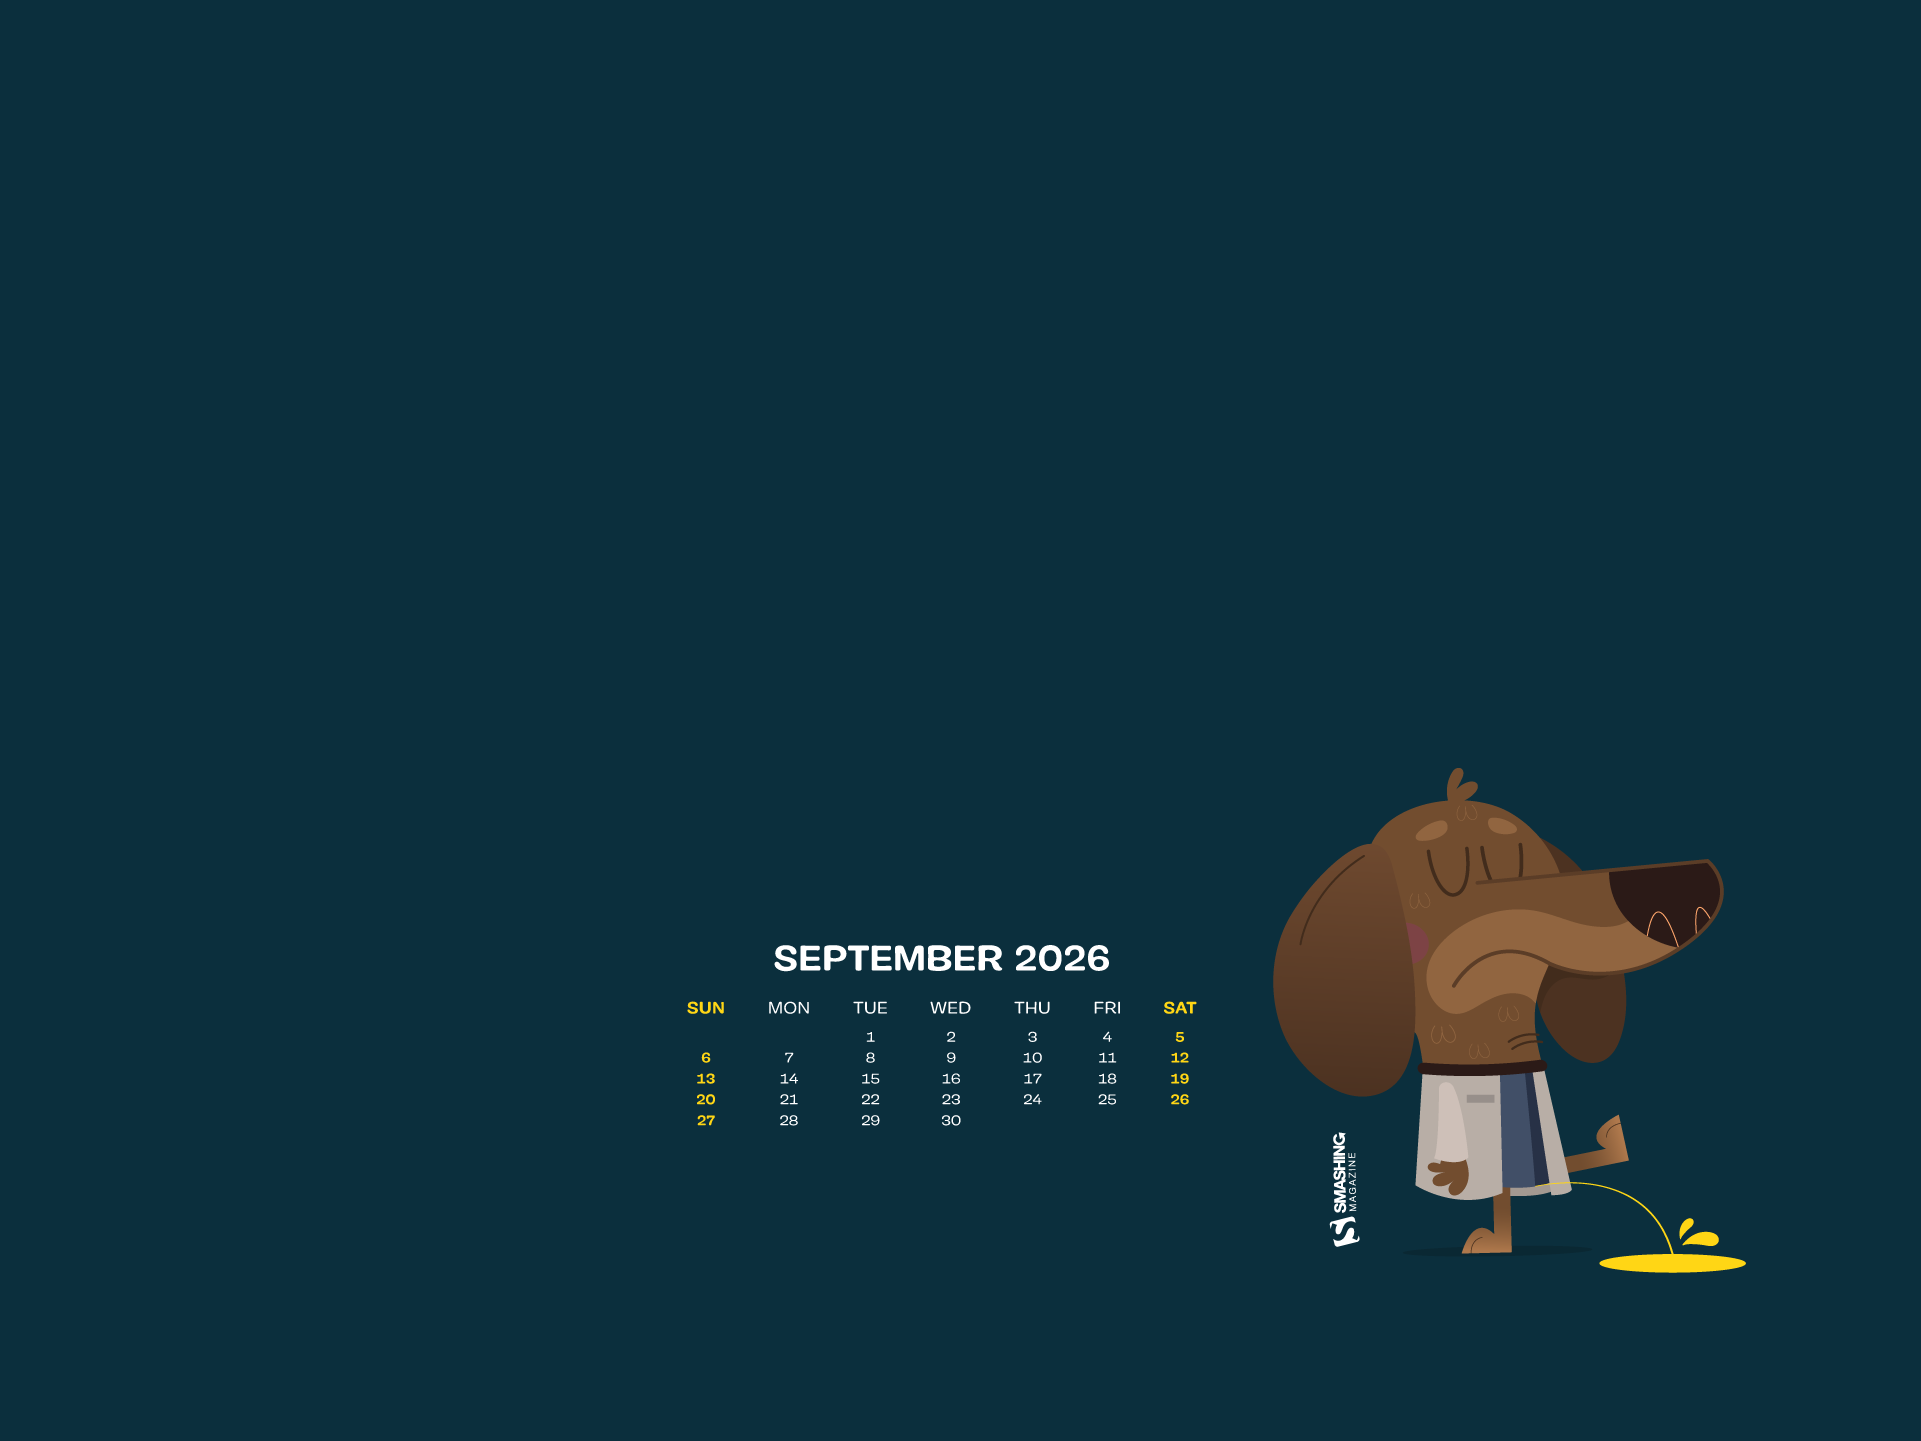
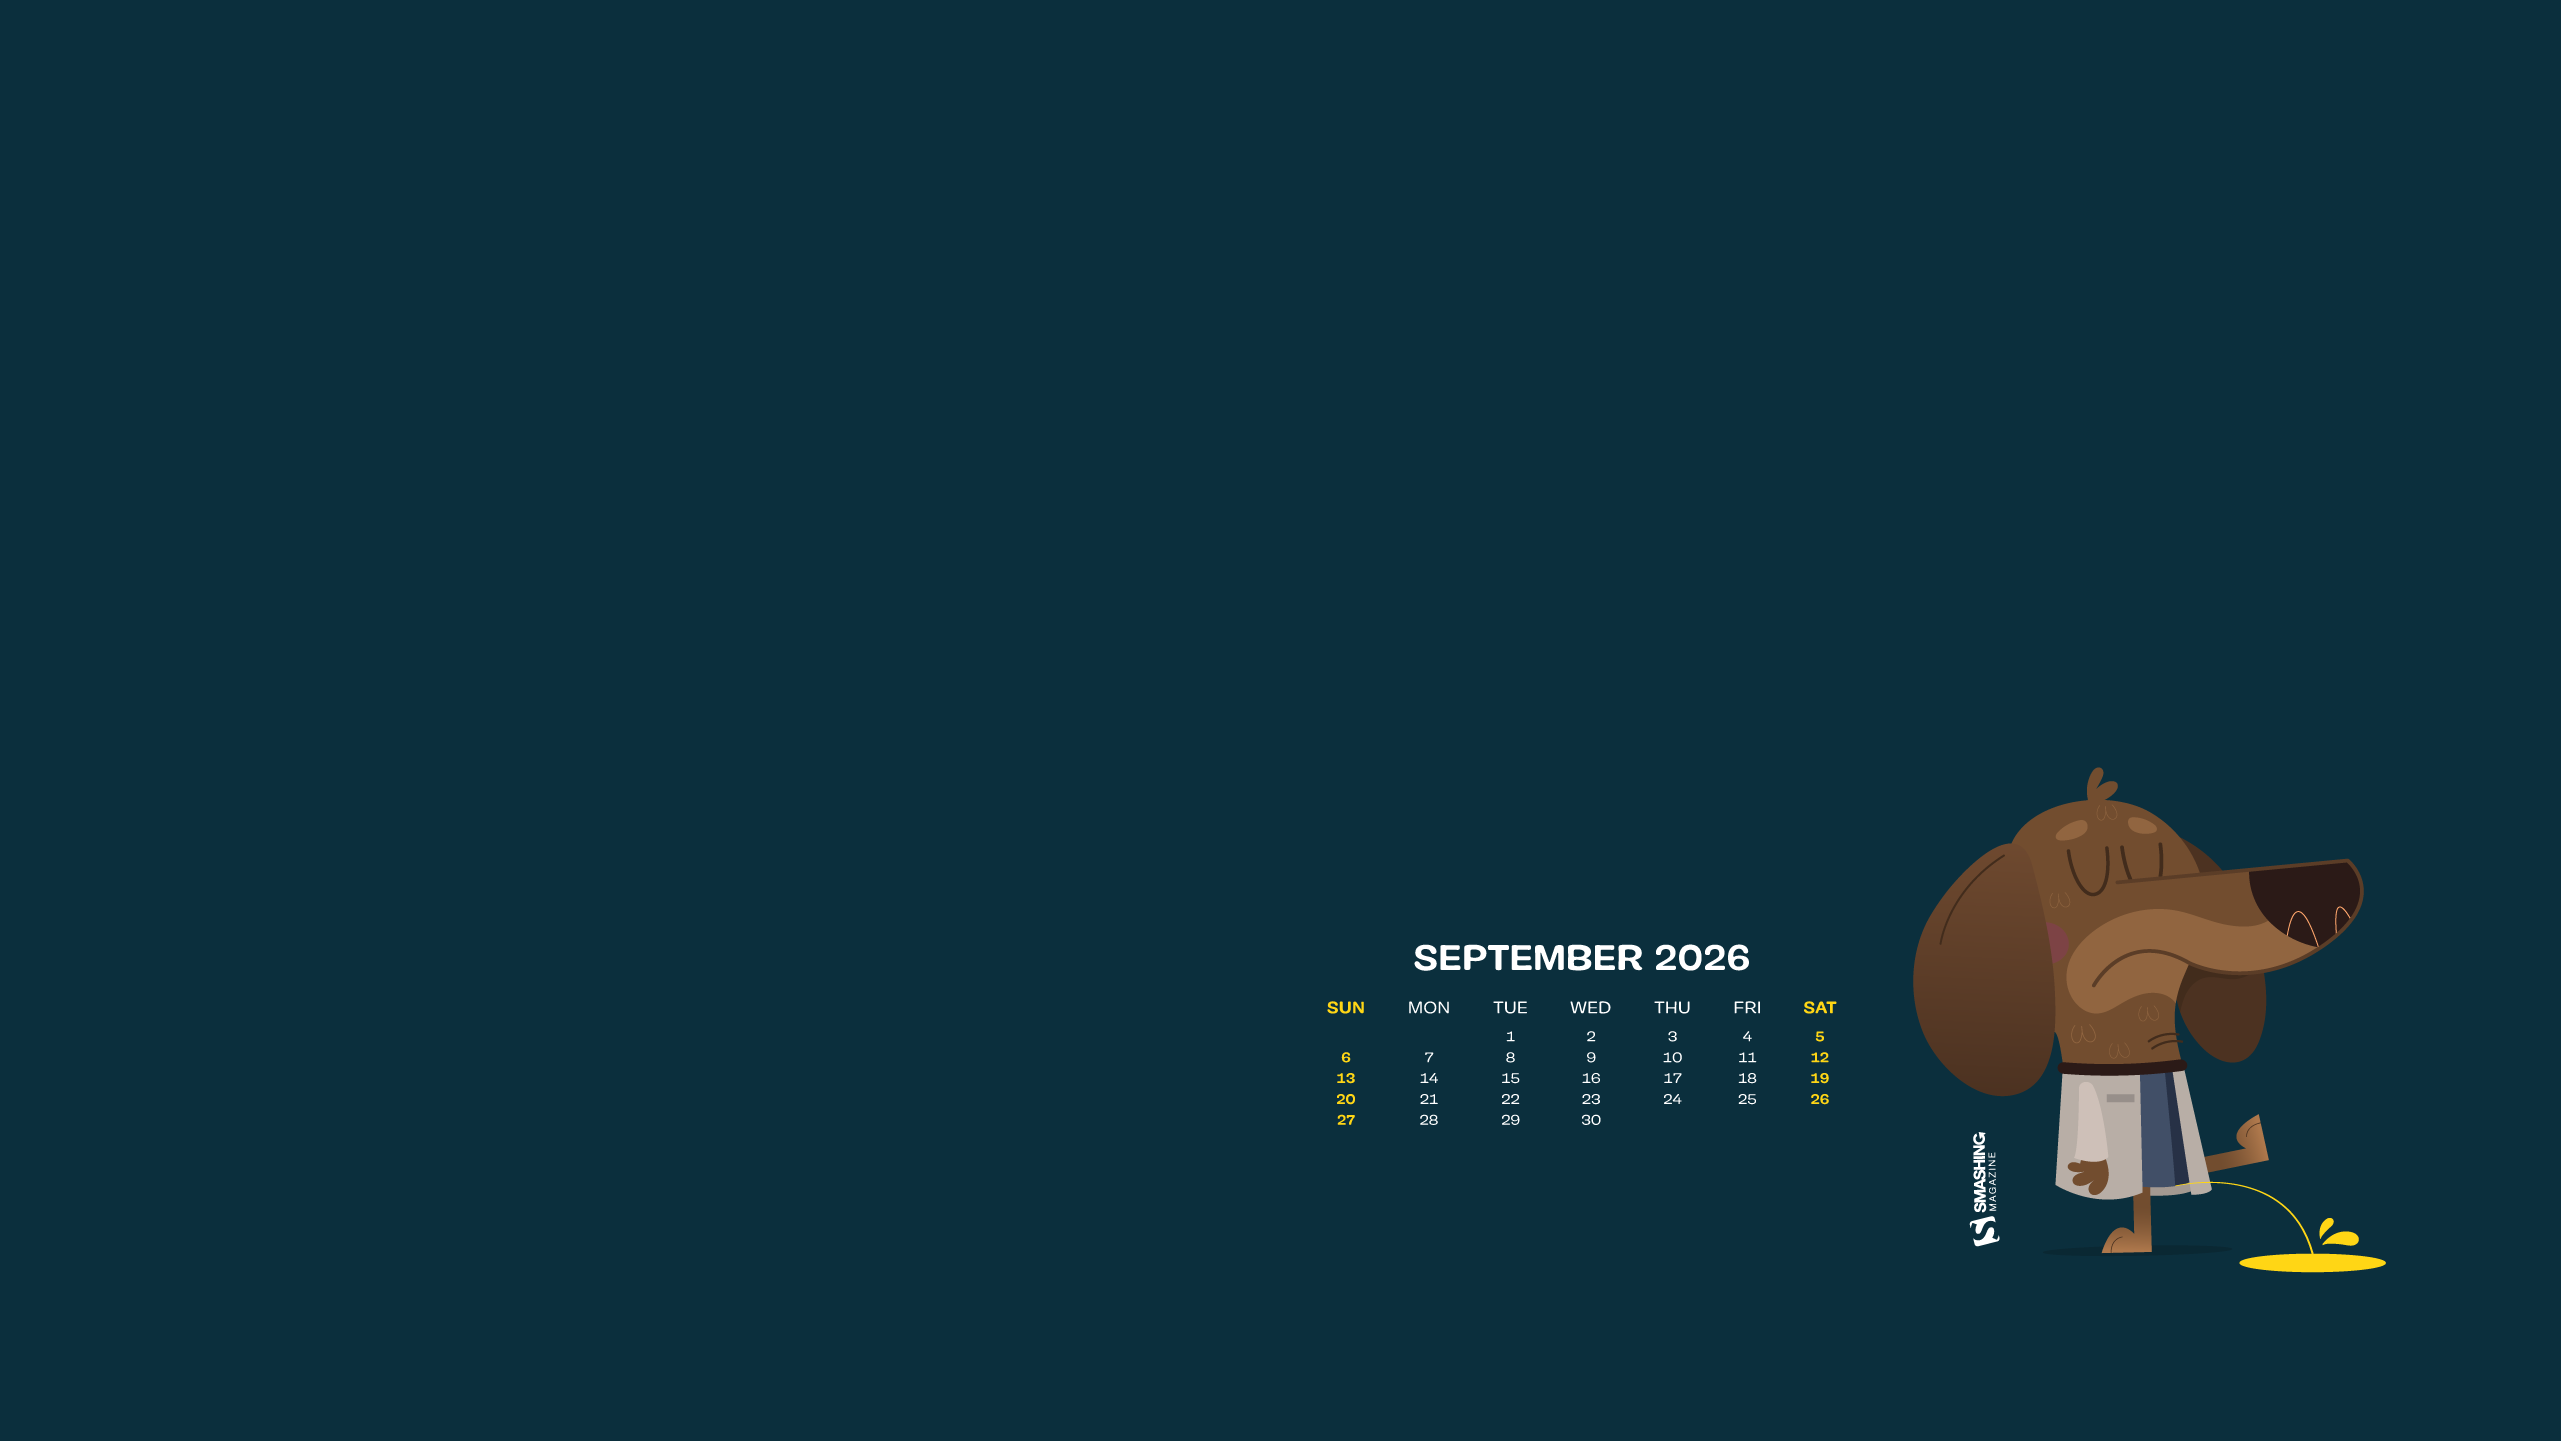
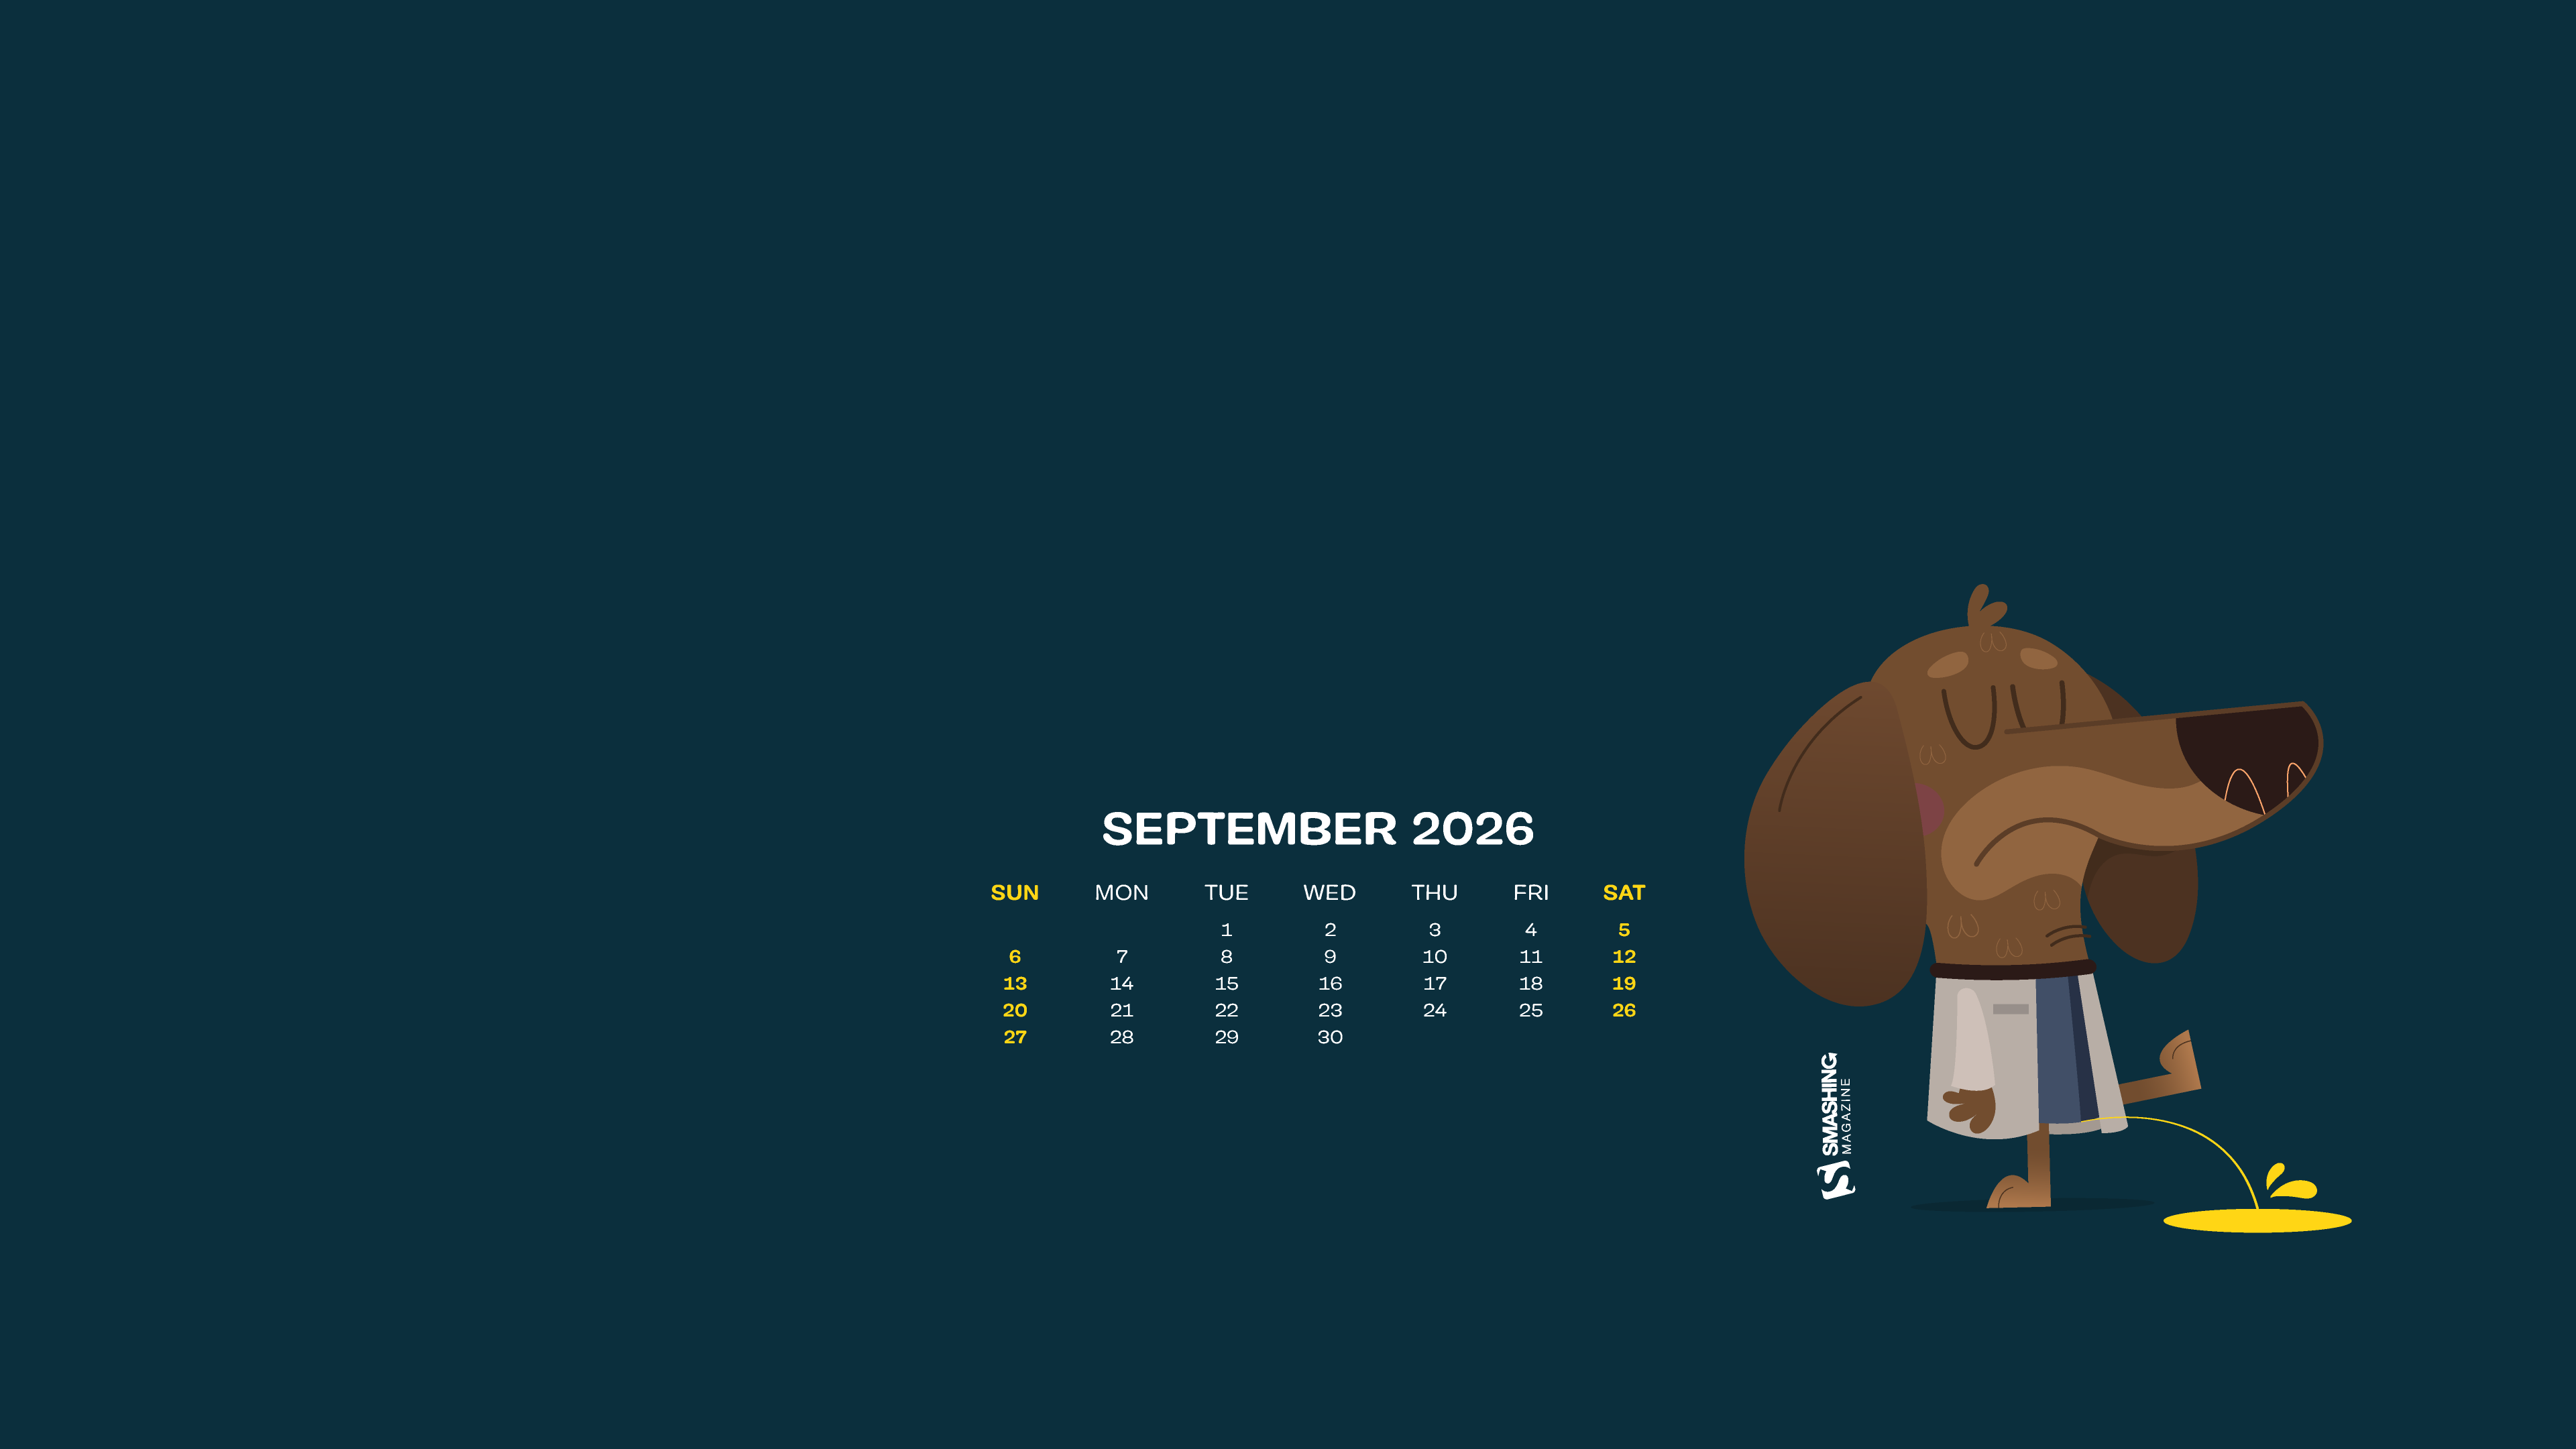





















“This autumn, we expect to see a lot of rainy days and blues, so we wanted to change the paradigm and wish a warm welcome to the new season. After all, if you come to think of it: rain is not so bad if you have an umbrella and a raincoat. Come autumn, we welcome you!” — Designed by PopArt Studio from Serbia.

- preview
- without calendar: 320x480, 640x480, 800x480, 800x600, 1024x768, 1024x1024, 1152x864, 1280x720, 1280x800, 1280x960, 1280x1024, 1366x768, 1400x1050, 1440x900, 1600x1200, 1680x1050, 1680x1200, 1920x1080, 1920x1200, 1920x1440, 2560x1440



“Cats are beautiful animals. They’re quiet, clean, and warm. They’re funny and can become an endless source of love and entertainment. Here for the cats!” — Designed by UrbanUI from India.

- preview
- without calendar: 360x640, 1024x768, 1280x720, 1280x800, 1280x960, 1280x1024, 1366x768, 1400x1050, 1440x900, 1680x1200, 1920x1080



“With the end of summer and fall coming soon, I created this terrazzo pattern wallpaper to brighten up your desktop. Enjoy the month!” — Designed by Melissa Bogemans from Belgium.
- preview
- without calendar: 320x480, 640x480, 800x480, 800x600, 1024x768, 1024x1024, 1152x864, 1280x720, 1280x800, 1280x960, 1280x1024, 1400x1050, 1440x900, 1600x1200, 1680x1050, 1680x1200, 1920x1080, 1920x1200, 1920x1440, 2560x1440


“As summer comes to an end, all the creatures pull back to their hiding places, searching for warmth within themselves and dreaming of neverending adventures under the tinted sky of closing dog days.” — Designed by Ana Masnikosa from Belgrade, Serbia.
- preview
- without calendar: 320x480, 640x480, 800x480, 800x600, 1024x768, 1024x1024, 1152x864, 1280x720, 1280x800, 1280x960, 1280x1024, 1400x1050, 1440x900, 1600x1200, 1680x1050, 1680x1200, 1920x1080, 1920x1200, 1920x1440, 2560x1440


“Seasons come and go, but our brave cactuses still stand. Summer is almost over and autumn is coming, but the beloved plants don’t care.” — Designed by Lívia Lénárt from Hungary.

- preview
- without calendar: 320x480, 800x480, 1024x768, 1024x1024, 1280x1024, 1400x1050, 1920x1080, 1920x1200, 1920x1440, 2560x1440



“The earth has music for those who listen. Take a break and relax and while you drive out the stress, catch a glimpse of the beautiful nature around you. Can you hear the rhythm of the breeze blowing, the flowers singing, and the butterflies fluttering to cheer you up? We dedicate flowers which symbolize happiness and love to one and all.” — Designed by Krishnankutty from India.

- preview
- without calendar: 320x480, 640x480, 800x480, 800x600, 1024x768, 1024x1024, 1152x864, 1280x720, 1280x960, 1280x1024, 1366x768, 1400x1050, 1440x900, 1600x1200, 1680x1050, 1680x1200, 1920x1080, 1920x1200, 1920x1440, 2560x1440



Designed by Ricardo Gimenes from Spain.

- preview
- without calendar: 320x480, 640x480, 800x480, 800x600, 1024x768, 1024x1024, 1152x864, 1280x720, 1280x800, 1280x960, 1280x1024, 1366x768, 1400x1050, 1440x900, 1600x1200, 1680x1050, 1680x1200, 1920x1080, 1920x1200, 1920x1440, 2560x1440



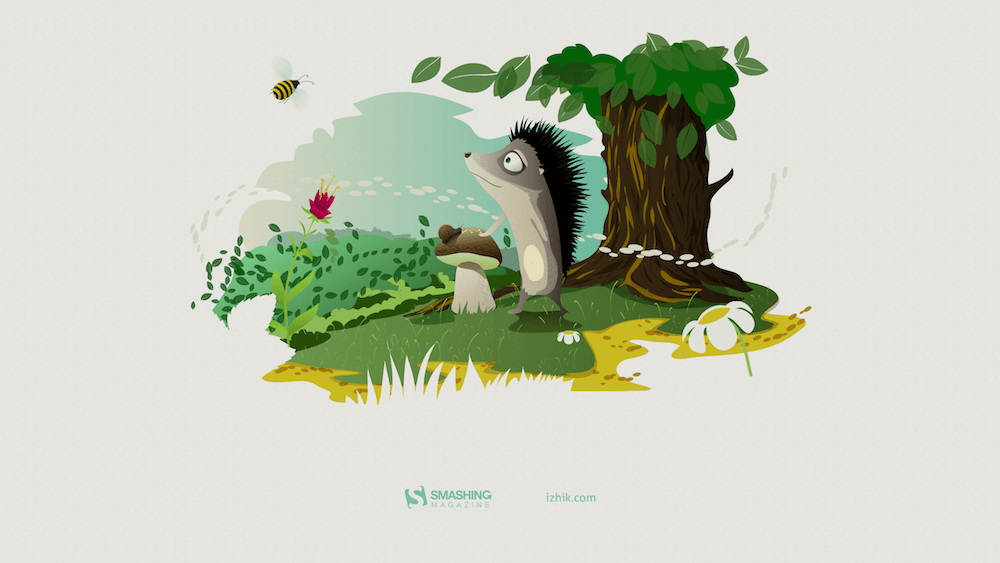
“It’s this time of the year when children go to school and grown-ups go to collect mushrooms.” — Designed by Igor Izhik from Canada.
- preview
- without calendar: 640x480, 800x480, 800x600, 1024x768, 1024x1024, 1152x864, 1280x720, 1280x800, 1280x960, 1280x1024, 1400x1050, 1440x900, 1600x1200, 1680x1050, 1680x1200, 1920x1080, 1920x1200, 1920x1440, 2560x1440, 2560x1600


Designed by Ricardo Gimenes from Spain.

- preview
- without calendar: 640x480, 800x480, 800x600, 1024x768, 1024x1024, 1152x864, 1280x720, 1280x800, 1280x960, 1280x1024, 1366x768, 1400x1050, 1440x900, 1600x1200, 1680x1050, 1680x1200, 1920x1080, 1920x1200, 1920x1440, 2560x1440, 3840x2160






















Designed by Elise Vanoorbeek from Belgium.

- preview
- without calendar: 640x480, 800x480, 800x600, 1024x768, 1024x1024, 1152x864, 1280x720, 1280x800, 1280x960, 1280x1024, 1366x768, 1440x1050, 1440x900, 1600x1200, 1680x1050, 1680x1200, 1920x1080, 1920x1200, 1920x1440, 2560x1440



“As summer comes to a close, so does the end of blue crab season in Maryland. Blue crabs have been a regional delicacy since the 1700s and have become Maryland’s most valuable fishing industry, adding millions of dollars to the Maryland economy each year. The blue crab has contributed so much to the state’s regional culture and economy, in 1989 it was named the State Crustacean, cementing its importance in Maryland history.” — Designed by The Hannon Group from Washington DC.

- preview
- without calendar: 320x480, 640x480, 800x600, 1024x768, 1280x960, 1440x900, 1600x1200, 1680x1050, 1680x1200, 1920x1080, 1920x1440, 2560x1440



“This month is Mexico’s independence day and I decided to illustrate one of the things Mexico’s best known for: the Lucha Libre.” — Designed by Maria Keller from Mexico.

- preview
- without calendar: 320x480, 640x480, 640x1136, 750x1334, 800x480, 800x600, 1024x768, 1024x1024, 1152x864, 1242x2208, 1280x720, 1280x800, 1280x960, 1280x1024, 1366x768, 1400x1050, 1440x900, 1600x1200, 1680x1050, 1680x1200, 1920x1080, 1920x1200, 1920x1440, 2560x1440, 2880x1800



“The leaves are changing their colors now, but the nights are still warm. There’s something different tonight… do you feel it? It’s like the air tastes like a soft marshmallow and you’re sitting by a warm fire in the middle of the forest, while the nature that surrounds you is transforming. It’s ok, small changes are normal and all you can do is sit back, look at the stars, and embrace the world that evolves around you.” — Designed by Creative Pinky from the Netherlands.

- preview
- without calendar: 640x480, 800x480, 800x600, 1024x768, 1152x864, 1280x720, 1280x800, 1280x960, 1280x1024, 1400x1050, 1440x900, 1600x1200, 1680x1050, 1680x1200, 1920x1080, 1920x1200, 1920x1440, 2560x1440



















Designed by Ricardo Gimenes from Spain.

- preview
- without calendar: 640x480, 800x480, 800x600, 1024x768, 1024x1024, 1152x864, 1280x720, 1280x800, 1280x960, 1280x1024, 1366x768, 1400x1050, 1440x900, 1600x1200, 1680x1050, 1680x1200, 1920x1080, 1920x1200, 1920x1440, 2560x1440, 3840x2160



“It is inevitable. Summer is leaving silently. Let us think of ways to make the most of what is left of the beloved season.” — Designed by Bootstrap Dashboards from India.

- preview
- without calendar: 360x640, 1024x768, 1280x720, 1280x800, 1280x960, 1280x1024, 1366x768, 1400x1050, 1440x900, 1600x900, 1680x1200, 1920x1080



“It’s officially the end of summer and I’m still in vacation mood, dreaming about all the amazing places I’ve seen. This illustration is inspired by a small town in France, on the Atlantic coast, right by the beach.” — Designed by Miruna Sfia from Romania.

- preview
- without calendar: 320x480, 640x480, 800x480, 800x600, 1024x768, 1024x1024, 1152x864, 1280x720, 1280x800, 1280x960, 1280x1024, 1440x900, 1440x1050, 1600x1200, 1680x1050, 1680x1200, 1920x1080, 1920x1200, 1920x1440, 2560x1440



Designed by Teodora Vasileva from Bulgaria.

- preview
- without calendar: 640x480, 800x480, 800x600, 1024x768, 1280x720, 1280x960, 1280x1024, 1400x1050, 1680x1050, 1680x1200, 1920x1080, 1920x1200, 1920x1440, 2560x1440















“I love September. Its colors and smells.” — Designed by Juliagav from Ukraine.

- preview
- without calendar: 320x480, 1024x768, 1024x1024, 1280x800, 1280x1024, 1440x900, 1680x1050, 1920x1080, 2560x1440



“Nature and our planet have given us life, enabled us to enjoy the most wonderful place known to us in the universe. People have given themselves the right to master something they do not fully understand. We dedicate this September calendar to a true nature lover, Vedran Badjun from Dalmatia, Croatia, who inspires us to love our planet, live in harmony with it and appreciate all that it has to offer. Amazon, Siberia, and every tree or animal on the planet are treasures we lose every day. Let’s change that!” — Designed by PopArt Studio from Serbia.

- preview
- without calendar: 640x480, 800x480, 800x600, 1024x768, 1024x1024, 1152x864, 1280x720, 1280x800, 1280x960, 1280x1024, 1366x768, 1400x1050, 1440x900, 1600x1200, 1680x1050, 1680x1200, 1920x1080, 1920x1200, 1920x1440, 2560x1440



“September is usually considered as early autumn, so I decided to draw some trees and leaves. However, nobody likes that summer is coming to an end, that’s why I kept summerish colors and style.” — Designed by Kat Gluszek from Germany.

- preview
- without calendar: 800x480, 1024x768, 1152x864, 1280x800, 1280x960, 1440x900, 1680x1200, 1920x1080, 2560x1440



Designed by Bojana Stojanovic from Serbia.

- preview
- without calendar: 320x480, 640x480, 800x480, 800x600, 1024x768, 1024x1024, 1152x864, 1280x720, 1280x800, 1280x960, 1280x1080, 1366x768, 1400x1050, 1440x990, 1600x1200, 1680x1050, 1680x1200, 1920x1080, 1920x1200, 1920x1440, 2560x1440



“September 12th brings us National Video Games Day. US-based video game players love this day and celebrate with huge gaming tournaments. What was once a 2D experience in the home is now a global phenomenon with players playing against each other across statelines and national borders via the internet. National Video Games Day gives gamers the perfect chance to celebrate and socialize! So grab your controller, join online, and let the games begin!” — Designed by Ever Increasing Circles from the United Kingdom.

- preview
- without calendar: 320x480, 640x480, 800x480, 800x600, 1024x768, 1024x1024, 1152x864, 1280x720, 1280x800, 1280x960, 1280x1024, 1366x768, 1400x1050, 1440x900, 1600x1200, 1680x1050, 1680x1200, 1920x1080, 1920x1200, 1920x1440, 2560x1440



“On September 1st, the first day of school in our country, schoolchildren across Serbia would write about what autumn feels like in their neighborhood. Usually, it’s the imagery of fallen leaves rustling under the feet, foggy and chilly mornings with the sun breaking between the murky clouds, a muffled sound of a chainsaw cutting firewood somewhere in the distance, the smells of fruits and vegetables being prepared for home canning. Autumn is the season of serenity, quietness, and reflection.” - Designed by PopArt Studio from Serbia.

- preview
- without calendar: 320x480, 640x480, 800x480, 800x600, 1024x768, 1024x1024, 1152x864, 1280x720, 1280x800, 1280x960, 1280x1024, 1366x768, 1400x1050, 1440x900, 1600x1200, 1680x1050, 1680x1200, 1920x1080, 1920x1200, 1920x1440, 2560x1440



“I designed this wallpaper to remind everyone that autumn is here.” — Designed by Advanced Web Ranking from Romania.

- preview
- without calendar: 800x600, 1024x768, 1280x800, 1280x1024, 1440x900, 1440x1050, 1600x1200, 1680x1200, 1920x1200, 1920x1440, 2560x1440



“While September’s Autumnal Equinox technically signifies the end of the summer season, this wallpaper is for all those summer lovers, like me, who don’t want the sunshine, warm weather, and lazy days to end.” — Designed by Vicki Grunewald from Washington.

- preview
- without calendar: 320x480, 640x480, 800x480, 800x600, 1024x768, 1024x1024, 1152x864, 1280x720, 1280x800, 1280x960, 1280x1024, 1366x768, 1400x1050, 1440x900, 1600x1200, 1680x1050, 1680x1200, 1920x1080, 1920x1200, 1920x1440, 2560x1440



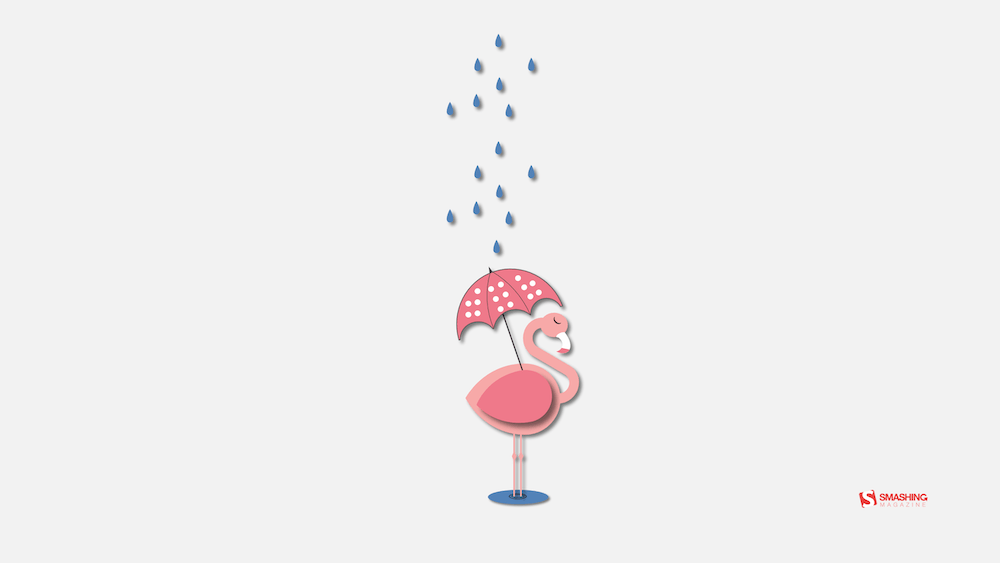
“Summer is officially over and we will no longer need our inflatable flamingos. Now, we’ll need umbrellas. And some flamingos will need an umbrella too!" - Designed by Marina Bošnjak from Croatia.
- preview
- without calendar: 320x480, 640x480, 800x480, 800x600, 1024x768, 1024x1024, 1152x864, 1280x720, 1280x800, 1280x960, 1280x1024, 1366x768, 1400x1050, 1440x900, 1600x1200, 1680x1050, 1680x1200, 1920x1080, 1920x1200, 1920x1440, 2560x1440


Designed by Ricardo Gimenes from Spain.

- preview
- without calendar: 640x480, 800x480, 800x600, 1024x768, 1024x1024, 1152x864, 1280x720, 1280x800, 1280x960, 1280x1024, 1366x768, 1400x1050, 1440x900, 1600x1200, 1680x1050, 1680x1200, 1920x1080, 1920x1200, 1920x1440, 2560x1440, 3840x2160



Feeling inspired? We’ll publish the October wallpapers on September 30, so if you’d like to be part of the collection, please don’t hesitate to submit your design. We are already looking forward to it!
Rethinking Data Visualisation: A UX Approach To Dashboards That Actually Drives Decisions
In organisations today, data has never been more available. Dashboards and performance decks exist for almost every function — sales, product, marketing, operations — and the tools to build them have never been more accessible. And yet, in weekly standups and quarterly reviews, the same thing happens constantly: someone shares the numbers, the room nods, and the meeting ends without a decision or clear direction.
When that happens, the data usually takes the blame. The numbers weren’t granular enough, the dataset wasn’t complete, we need more information before we can act. But the data is almost never the problem. The reality is that nobody designed it to deliver insights. The chart was built from what was available, not from the question that needed answering. The audience was assumed rather than understood, and what should actually change as a result of seeing this data — that question — was never asked at all.
Data visualisation and UX are solving the same underlying problem: both are trying to move the right information to the right person in a way that changes something. The vocabulary is different, but the underlying challenge is identical, and the moment you start treating them as complementary disciplines is the moment dashboards stop being a passive collection of charts and start doing something functional.
For designers who work with data, analysts who present to non-technical audiences, and marketers who need their numbers to do more than sit in a slide, this read is for you.
The Chart Was Never The Whole StoryIn 1973, the statistician Francis Anscombe (PDF) published a paper that made a quiet but clarifying point. He constructed four datasets that are statistically identical: same mean, same variance, same correlation coefficient, and same regression line. Run the numbers on any of them, and they are identical. Plot them, and they could not be more different.
Anscombe’s lesson to statisticians was about diagnosis: visualisation reveals the operational truth that raw numbers conceal.
But visualisation isn’t just diagnostic; it is also communicative. The form you choose is where understanding either emerges or gets lost in the noise. Does your audience walk away with numbers, or with a story they’ll quote and talk about?
One of the most striking examples is Visual Capitalist’s History of Pandemics. Instead of burying the reader in a massive data table of casualty counts, it maps the death toll of major historical pandemics using a proportional bubble layout on a single timeline.
Before your brain reads a single number, your visual system grasps the sheer scale of the Black Death relative to everything else on the page. The right visualisation does not just plot the data but makes the story impossible to miss.
Edward Tufte codified a foundational principle for the craft with his data-ink ratio: every mark on a chart should serve the data, not decorate it. It remains a widely used framework in data visualisation, anchored in the assumption that clarity and visual hygiene are the goal.
For a chart in isolation, that holds. But a chart is never read in isolation: it’s read by a person, in a specific context, under specific pressure. Strip a chart down to its cleanest form, and you might be removing the exact layer of context a decision-maker needs. Simplicity isn’t the goal in itself; appropriate complexity is.
Data is a message, and the right amount of signal depends entirely on who’s receiving it.
Which leads to the core principle of data UX: roughly 80% of the work that determines whether a dashboard succeeds happens before you ever draw a chart.
That dependency is the thread the rest of this piece pulls on.
The 80% That Happens Before The ChartThe high-leverage 80% almost never happens on screen. It happens upstream: before a tool is opened, before a dataset is pulled, before a single design choice is made. It comes down to three questions, and once they become habitual, they change what you notice, what you ask, and what you push back on at the outset of every project.
- Context: What are we trying to show with this data?
This is where you define what the visualisations actually need to serve before you touch any raw data. Writing down the precise operational questions, specifically enough to determine what gets pulled and what gets filtered, is what produces a dashboard that helps with decision-making. - Audience: Who is this for, and how do they think?
This is the empathy step. Knowing who’s in the room, what they’re accountable for, and how they engage with data determines how much complexity the visualisation can carry, and how it should be presented. - Insight: What should change once this data lands?
A decision, a new direction, a shift in understanding. If the intended strategic outcome isn’t clear during the design phase, it will remain invisible once the dashboard goes live.
Most data-heavy projects start backward: teams pull whatever metrics their internal analytics tools already track and build visualisations around them, while the question the data was supposed to answer either gets assumed or never gets asked. This happens simply because we anchor on the data in front of us as the boundary of what’s possible.
Defining a goal first sounds obvious, but in practice, it rarely happens with the necessary clarity. “Show me how the product is performing” is not a goal; “Identify which features drive retention among users who signed up in Q1” is, as it includes three things the first doesn’t: a metric, a population, and an implied action. That specificity is what converts an open-ended exploration into a constrained, answerable design problem. Which one you start from determines everything that follows: what you include, what comparisons matter, and what you leave out entirely.
Starting with available data produces a dashboard that answers no particular question, because it was never built for one — every number is present, none of them pointed anywhere. Starting with the operational question does the reverse: every element on the screen earns its place, because each one is there to help answer it.
For example, consider a UX team trying to fix a leaky checkout flow for an e-commerce website. A data-first approach pulls everything available, from clicks to scroll depth and device types, yielding a massive dashboard that leaves everyone asking, “Okay, but what do we actually change?” A context-first approach starts with a constraint: “At which step of the checkout do users drop off?” By filtering out 90% of the noise, the team builds a simple funnel chart, instantly spots a bottleneck on the payment screen, and knows exactly what to redesign.
Audience: Who Is This For, And How Do They Think?Designing for an audience comes down to two things: accountability and familiarity.
Familiarity is about data literacy. Do they read charts instinctively, or does a complex visualisation create friction? Handing a dense, multi-layered dashboard to a Head of Sales and a senior analyst is like giving the same map to someone who navigates by landmarks and someone who reads grid coordinates. The data is accurate, but it is only functional for one of them.
Accountability dictates how that complexity must be presented. A chart showing a 12% decline carries vastly different weight for the executive responsible for that number versus the analyst simply reporting it. Understanding your audience means grasping this relationship; data is never processed neutrally when your performance is on the line.
Together, familiarity and accountability decide one practical thing: how much you can put in front of someone.
In data visualisation, simplicity is not a fixed virtue — the right level of it is contingent on who is reading, and what they need to do.
An analyst relies on a high-density environment to conduct diagnostic discovery. By isolating individual behaviour nodes and mapping out raw user flows, they interrogate the data at its atomic level to uncover the hidden insights and underperforming spend that will shape future campaigns.
An executive, by contrast, requires a highly synthesised translation of that data to immediately identify what is driving commercial growth. Tailoring a dashboard to your audience means adjusting the density dial, delivering maximum signal with appropriate complexity for the specific brain in the room.
Insight: What Should Change Once This Data Lands?Most data projects operate on the comfortable assumption that if a chart is accurate and clear, the insight will take care of itself. In reality, information and insight are entirely different states. Information is what the data shows, whereas insight is the specific decision, shift in understanding, or course correction someone makes as a result of seeing it. If the intended business change isn’t defined before the design begins, a dashboard will default to passive reporting rather than driving action.
Marketing and engineering teams experience the danger of this gap whenever a core business metric suddenly plummets.
A dashboard built for information simply sounds the alarm, showing a chart that tracks a sharp 15% drop in booking rates. Because the data lacks depth, leadership defaults to panic: they immediately call the UX design team, assuming the app is broken or the checkout flow is flawed. Because the data doesn’t pinpoint the core of the problem, it triggers a costly, misplaced fire drill.
A dashboard built for insight isolates the variables required to make an informed decision. Instead of a single, flat booking metric, the visualisation maps the drop against traffic sources and campaign launches — instantly revealing that while app performance and core user conversion are perfectly stable, the sitewide rate was artificially diluted by a massive influx of low-intent click traffic from a newly scaled campaign. The team doesn’t waste time redesigning a functioning app; they get the exact insight needed to pause the underperforming marketing campaign and adjust their acquisition strategy.
Every visualisation implies a next step, even if that step is “nothing needs to change right now.” The question is whether the design makes that implication clear enough for the viewer to recognise it.
From Questions To Dashboard: A Project Walk-throughMy aha moment in data visualisation happened during a project for a client-facing B2B SaaS platform focused on enterprise talent management and competency tracking in Pegasystems skills. The platform captured a massive footprint of daily telemetry, and the brief arrived open-ended: “We have an immense archive of user activity, now we need to present it to enterprise teams.”
We could very easily have charted everything that was captured, but we wouldn’t be doing end users any favours if they just ended up looking at a data graveyard. My responsibility immediately moved beyond pure interface craftsmanship; it became about architecting a highly practical tool for real people who would open this dashboard routinely and need it to tell them an honest, immediate story about their workflows.
Here is how the project actually went.
ContextThe client believed this massive pool of data could help their users perform better, and wanted an interface that finally enabled that growth. Translating that broad ambition into tangible visualisations required defining the practical mechanics of performance. What variables indicate advancement vs passive usage? What does “perform better” actually mean? How do you measure it?
An obvious candidate was time spent by product. Every platform tracks it. It is easy to show, and it feels meaningful. But time spent is a proxy; it tells you someone was there, not whether they got anything out of it.
The more meaningful signals were competency scores by area, certification completion rates, and historical performance trajectories. Integrating time-spent data alongside these performance metrics added a useful layer of interpretation, helping us surface which modules users were underutilising and whether that directly correlated with lagging scores. Time spent became a supporting signal in the larger story.
The second question was about the appropriate level of granularity. An identical metric carries completely different weight depending on who is looking at it. An individual contributor tracking their own completion rate needs to know if they are pacing correctly, whereas a manager reviewing a team aggregate needs to know precisely who requires immediate support. This distinction shaped every subsequent data-exposure and filtering decision. Defining that structural story early determined exactly what to show, and to whom.
AudienceThe most straightforward approach to this design would have been predictable: use the same charts, but offer an individual view and an aggregated team view. Far too many dashboards rely on this shortcut, subtly tweaking the scale of identical data visualisations and labelling it “personalisation.”
An authentic analysis of the audience reveals a much deeper rift. Frontline team leads and individual contributors required distinct narrative structures and design principles.
Having used e-learning platforms myself, I remember the frustration of opening a tool without a clear sense of my current standing, core strengths, or slipping metrics. That personal experience directly guided the individual contributor workspace; it needed to act as a highly tailored, self-directed mirror that was granular, honest, and personal.
Conversely, the manager’s interface had to bypass individual milestones initially to provide a macro pulse check on team vulnerabilities. It was designed around a different operational reality: how is the group progressing, and where are the consistent gaps? The view prioritised the aggregate picture first, while retaining an intuitive path to drill down into tactical day-to-day coordination when needed.
InsightOur insight strategy was locked in during the early conceptual phase, long before wireframing a single chart. We intentionally abandoned the idea of building a dense, passive data log and focused on pacing the narrative arc.
For individual contributors, the core value was self-direction, ensuring they could glance at the interface on a Monday morning and immediately derive a clear priority list for the week ahead.
For managers, the goal was to fundamentally shift the timing of operational conversations, providing them with the necessary baseline to intervene before a skill gap evolved into a critical project failure. The visualisations needed to surface the exact moments when a human check-in would be useful, shifting their workflow from reactive post-mortems to proactive guidance.
The comparison tool was the highlight nobody had asked for. A manager dashboard and an individual dashboard are easy to anticipate. What is harder to land is: what if a manager wants to compare two specific team members against the same metrics, side by side? That view came from a design assumption, and it turned out to be the feature that resonated most.
The decisions that mattered most in this project weren’t in the initial brief — capturing data they hadn’t thought to request, and structuring it to answer questions they had not previously known how to articulate, which is the core differentiator of a user-centric data strategy.
Designing The Mental Model EarlyThe choice of visualisation layout must follow the geometric nature of the data itself. For this project, the core design problem was enabling an individual user to answer a specific question at a single glance: across eight distinct competency areas, where are my relative strengths and gaps?
To solve this, we mapped the data using a radar chart. By organising multiple variables across axes radiating from a central point using polar coordinates, the interface connects the data points to form a single, unified shape. An even, balanced polygon instantly signals well-rounded proficiency, while a sharply skewed shape draws the eye immediately to an outlier area.
While a traditional linear bar chart would have forced the viewer to scan eight individual bars and mentally calculate the variance, a concentric, radial layout segments the data layers to make progress tracking and skill gaps immediately readable. When all dimensions share an identical scale and scoring method, the radar chart is not an unconventional aesthetic choice — it is the most functional tool for multi-dimensional analysis.
The colour system was the other decision made early, and I mean early. During the branding exercise, each of the three products was assigned a colour. That colour did not stay in the brand guidelines. It was built into the data model from the beginning, running consistently across every chart, every filter, every breakdown. By the time a user landed on the dashboard for the first time, the mental model was already in place. They had not been taught the language. They already knew it.
What ChangedThe shift from passive information to active insight showed up first in how the dashboard was actually used. Following the deployment of the personalised dashboards and side-by-side team comparison tools, weekly active engagement on the platform’s analytics features rose noticeably, per internally reported figures. Managers were no longer opening the tool once a month to pull static reports. They were using it every Monday morning to actively plan their week.
Revenue and user growth also moved in the right direction over the following two quarters, though — as with most single-project outcomes — it’s hard to isolate the dashboard’s exact contribution from everything else that changed at the same time. The client reported churn across the platform falling to one of its lowest points on record. The clearest evidence of impact came from qualitative feedback. Managers reported that instead of using data to dissect a ‘bad’ month after the fact, the visualisations allowed them to instantly spot slipping performance and schedule a quick supportive catch-up before it turned into a real gap.
ClosingData design reaches its full potential when visual presentation is treated as an upstream architectural choice rather than a downstream formatting step. Bringing structured UX thinking to data turns visualisations into active decision-making engines, ensuring every chart, report, and metric directly serves a human purpose:
- Upstream framing: Grounding every visual choice in a specific operational question rather than defaulting to available metrics.
- Calibrated density: Tuning the level of complexity directly to the literacy and accountability of the specific reader.
- Decision-driven insight: Structuring data to reveal strategic outcomes rather than isolated stats, turning visual signals into immediate operational momentum.
The next time you are tasked with creating a data visualisation — whether it is an enterprise dashboard, an executive report, or a public-facing infographic — step away from the design canvas and BI tools. Focus your initial effort on the human decisions behind the screen. Only then will your data stop being a passive log of the past and start driving the direction of the future.
Why Your Website Should Never Stop Changing
This article is a sponsored by Fimo
Every website is at its best the day it ships. The final branch merges, the site goes live exactly as designed, and it is briefly perfect. It will never be this good again.
Not because anything breaks. The site keeps working. But the market moves, the messaging shifts, a competitor launches something, and the careful thing you built slowly stops matching the company it represents. A year later, it is a period piece. Not broken, just behind. Every team knows this decay, and almost everyone treats it as a law of nature.
It doesn’t have to be that way. A website could keep improving after launch instead of drifting away from its best day, quietly optimizing itself while the team that built it works on something else.
Picture it working: while you sleep, an agent catches that last week’s design-system change never propagated to the pricing page, and fixes it. Another finds a set of images shipped uncompressed in a rushed release and optimizes them. A third flags an accessibility regression a new component introduced, and either fixes it or leaves it for you to check. You wake up to a site that is measurably better than the one you left, and a short list of the few decisions the agents wanted your eyes on. That is the version worth wanting.
And the moment you take that promise seriously, you run into a problem that has nothing to do with the technology:
Almost nobody actually wants a website that changes entirely on its own. Why “Just Make It Autonomous” Is The Wrong GoalThe obvious move, once you have capable agents, is to hand them the whole site. Let them write, edit, optimize, and publish, and get out of the way. It sounds like the natural endpoint, and it is the first thing most people picture when they hear “autonomous website.”
It is also the thing almost nobody wants once it is real in front of them.
We learned this the way you learn most things worth knowing: by building the opposite first. Building Fimo, an autonomous website platform, we set out to make websites fully autonomous, assumed that was the goal, and then watched what people actually did with it. What they did was hesitate. Not because they distrusted the agents, but because a website has no single owner. Different parts belong to different people, and each one wants a different amount of autonomy. So the question was never whether to trust the agents. It was where to draw the line, and for whom.
Once you ask it that way, the work splits cleanly into three kinds.
And they don’t stay fixed. They learn from their tasks and from what you teach them, so the boundary you set last month isn't the one you’re stuck with. What you had to approve then, you can delegate now, not because you lowered your guard but because the agent earned it. The line is not a setting you configure once. It moves as trust is earned, in the direction of less work for you.
Start Narrow, and Widen As You Trust ItNone of this means flipping a site to autonomous on day one. In practice it goes the other way. You delegate a little, watch how it does, and loosen.
And you can actually watch. Every agent’s runs, its history, its logs, and a before-and-after of what it changed are there to inspect. Trust doesn’t grow because you got used to the idea; it grows because you can see what happened and compare. The first time an agent quietly fixes something you would have missed, and you can see exactly what it did, the next delegation gets easier.
Deadlines keep you from becoming the bottleneck on what you have already handed over. If you don’t weigh in, the agent proceeds. You set the terms once, and you stop being the thing the whole site waits on.
The Frozen Site Is The Real RiskThe worry people voice first is that an agent will change something on their site without them. Turn it around: the real risk is a site that never changes at all. A frozen site doesn’t stay safe. It just falls behind, slowly, in a way nobody notices until it represents a company that no longer exists.
The point of autonomy was never to remove you from your website. It was to remove the decay.
The point of autonomy is to keep the launch-day version from being the best version, and to let you spend your judgment on the handful of things that actually deserve it, while the rest takes care of itself. Draw the line where your value is. Let the agents hold everything on the other side of it. And let the line move as they prove they can.
Sidor
